| Frequency range (Hz) | Table single amplitude (inch) |
|---|---|
| 4 to 15 | 0.030 ± 0.006 |
| 16 to 25 | 0.020 ± 0.004 |
| 26 to 33 | 0.010 ± 0.002 |
528.1 -II. Duration of endurance test in a given orthogonal direction at each test frequency
| Number of endurance test frequencies | Test time duration at each endurance test frequency | Total time |
|---|---|---|
| 1 | 2 hours | 2 hours |
| 2 | 1 hour | 2 hours |
| 3 | 40 minutes | 2 hours |
| 4 | 40 minutes | 2 hours, 40 minutes |
| n>2 | 40 minutes | 40 x n minutes |
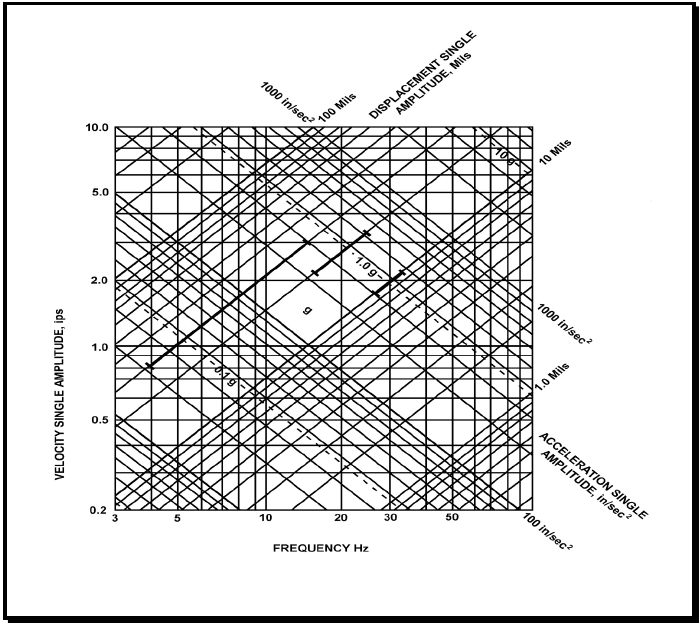
Figure description:
Vibration Frequency-Amplitude Relationship Chart
Vibration Nomograph
Legend
- Velocity Single Amplitude (ips — color: black; symbol: Vertical axis
- Frequency (Hz — color: black; symbol: Horizontal axis
- Displacement Single Amplitude (Mils — color: black; symbol: Positive slope diagonals
- Acceleration Single Amplitude (in/sec² — color: black; symbol: Negative slope diagonals
- Specific vibration profile — color: black; symbol: Bold line segments
Annotations
- 1.0 g (text_label - position: Diagonal line sloping downward from left to right, highlighted with tick marks)
- 0.1 g (text_label - position: Dashed diagonal line below 1.0 g line)
- 10 g (text_label - position: Dashed diagonal line above 1.0 g line)
- g (text_label - position: Centered in diamond-shaped grid area)
| Series | Frequency (Hz) | Velocity (ips) | Displacement (Mils) | Acceleration (in/sec²) |
|---|---|---|---|---|
| Displacement 1.0 Mil | 31.83 | 0.20 | 1.0 | 40.0 |
| Displacement 1.0 Mil | 100.00 | 0.628 | 1.0 | 394.8 |
| Displacement 10 Mils | 3.18 | 0.20 | 10.0 | 4.0 |
| Displacement 10 Mils | 10.00 | 0.628 | 10.0 | 39.5 |
| Displacement 10 Mils | 100.00 | 6.283 | 10.0 | 3948.0 |
| Displacement 100 Mils | 3.00 | 1.885 | 100.0 | 35.5 |
| Displacement 100 Mils | 15.92 | 10.00 | 100.0 | 1000.0 |
| Acceleration 100 in/sec² | 3.00 | 5.305 | 281.4 | 100.0 |
| Acceleration 100 in/sec² | 79.58 | 0.20 | 0.4 | 100.0 |
| Acceleration 1000 in/sec² | 15.92 | 10.00 | 100.0 | 1000.0 |
| Acceleration 1000 in/sec² | 100.00 | 1.592 | 2.5 | 1000.0 |
| Acceleration 0.1 g | 3.00 | 2.048 | 108.7 | 38.6 |
| Acceleration 0.1 g | 30.73 | 0.20 | 1.0 | 38.6 |
| Acceleration 1.0 g | 6.15 | 10.00 | 258.9 | 386.1 |
| Acceleration 1.0 g | 61.45 | 1.00 | 2.6 | 386.1 |
| Acceleration 1.0 g | 100.00 | 0.615 | 1.0 | 386.1 |
| Acceleration 10 g | 61.45 | 10.00 | 25.9 | 3861.0 |
| Bold Profile | 4.00 | 0.83 | 33.0 | 20.9 |
| Bold Profile | 14.50 | 3.00 | 33.0 | 273.6 |
| Bold Profile | 20.50 | 3.00 | 23.3 | 387.0 |
| Bold Profile | 31.00 | 1.98 | 10.2 | 386.1 |
Notes: The chart is a four-way logarithmic nomograph relating frequency (Hz, velocity (ips, displacement (mils, and acceleration (in/sec². The bold lines define a specific vibration envelope consisting of a constant displacement segment (33 mils, a constant velocity segment (3.0 ips, and a constant acceleration segment (1.0 g. The values for g are based on standard gravity ≈ 386.1 in/sec².)))))))
Figure 528.1-1. Type I environmental vibration limits (black bars represent a graphical presentation of Table 528.1-I expressed in displacement, velocity, and acceleration)
528.1 -IV. Types of balancing
| Rotor Characteristics | Speed (rpm) | Type of Balancing | Balancing Methods and Limits |
|---|---|---|---|
| Rigid, L/D 1/ ≤0.5 | 0-1000 | Single-plane | 5.2.2 |
| >1000 | Two-plane | 5.2.2 | |
| Rigid, L/D>0.5 | 0-150 | Single-plane | 5.2.2 |
| >150 | Two-plane | 5.2.2 | |
| Flexible | All | Multi-plane (more than two planes) | 5.2.3 |
L - Length of rotor, exclusive of shaft.
D – Diameter of rotor, exclusive of shaft.