| NOMENCLATURE | DESCRIPTION |
|---|---|
| M105A2 | U.S. 1-1/2 ton trailer |
| N/A | German 1-1/2 ton trailer |
| M1102 | U.S. 1-1/4 ton trailer |
Measured Locations: 9 locations on frame under cargo bed (3X3 matrix).
Type of Test Load: Sand filled ammo boxes (or other similar cargo) were secured to the cargo bed, and loaded to 34 of vehicle rated load.
Scenario to be Simulated: 51.5 km (32 mi) from the forward supply point to the using unit described as follows: The typical mission/field transport scenario starts at the port staging area (PSA). The movement prior to this point would include transport by commercial common carrier, military long-range aircraft, ship, and/or railroad. This movement would occur over improved road surfaces or in platforms that have been proven to impose significantly lower vibration levels than those vehicles used for transport from the port staging area to the using unit. The typical scenario has established that 51.5 km (32 mi) of transport are expected between forward supply point to the using unit. This transport is in two-wheeled trailers. The road surfaces will be paved, secondary, and cross-country.
Assumptions (Scenario, Load, Failure Mechanism, etc.):
Total Mission of 51.5 km (32 miles) is accounted for as follows:
- • 15 percent of total mission, 7.7 km (5 miles), is on-road and considered benign compared to the off-road environment.
- • 85 percent of total mission, 43.8 km (27 miles), is off-road:
- One-third of the off-road environment, 14.6 km (9 miles), is rough terrain consistent with the Belgian Block, Two-Inch Washboard, Radial Washboard, and Three-Inch Space Bump courses used to collect data. Average Speed over these courses was 26 km/hr (16 mph).
- Two-thirds of the off-road environment, 29.2 km (18 miles), is considered benign compared to the test conditions described above.
Failure mode: fatigue
Test Time Compression: None; this test is run in real time.
Test Time: 32 minutes per axis
Exaggeration Factor: 1.00
MIL-STD-810H
METHOD 514.8, ANNEX C
Method of Combination of Spectra: A statistical method as described in Annex F, Appendix C,
- was used to create the spectra for the individual trailers in Table 514.8C-III. This method makes use of the spectral variance from different measurement locations and test conditions and produces a spectrum that is a very conservative estimate of the actual measured environments. This procedure produced an ASD for each trailer in each of the orthogonal axes. The composite two-wheeled trailer spectrum was created by enveloping the individual trailers. Ideally a statistical method would have been used (as was done for the Composite Wheeled Vehicle below) but because the number of samples was so low an enveloping method was employed.
- Location of Control Accelerometer(s): 2 accelerometers at opposite corners, within 30 cm (12 in.) from test item
Recommended Control Scheme: Average (Extremal control may be appropriate for some
- applications). Based on the field data characteristics and the conservatism associated with the composite vehicle VSD process, drive limiting to 3 sigma is recommended.
For movement direction definitions, see paragraph 4.4 in the front part of this Method.
| RMS Acceleration:1,3 (G-rms): | |
| Vertical | – 3.98; |
| Transverse | – 1.22; |
| Longitudinal | – 2.52; |
| Envelope | – 4.03. |
| Velocity (in/sec) (peak single amplitude):1,3 | |
| Vertical | – 33.29; |
| Transverse | – 15.23; |
| Longitudinal | – 18.18; |
| Envelope | – 33.30. |
| Displacement (in) (peak double amplitude):1,2,3 | |
| Vertical | – 1.51; |
| Transverse | – 0.69; |
| Longitudinal | – 0.79; |
| Envelope | – 1.51. |
^1 Approximate values for a Gaussian random distribution which may vary based on the control system and spectral resolution. Peak velocity and displacement values are based on an acceleration maximum of three times the standard deviation (3σ) and a spectral resolution of 1 Hz.
² For shaker systems that are incapable of the displacement requirements of this schedule, minor adjustments may be made to the low frequency within the tolerances specified in 4.2.2.1a (main body) to accommodate the shaker limitations. If any schedule needs to be modified, make sure that all parties involved (tester, customer, etc.) are aware of the reason for the changes, and agree to the changes prior to test. Ensure an adequate test is performed and all deviations from the published schedules are properly documented.
³ For test items for which the test item orientation is unknown or variable the Envelope profile should be run for all three axes (Figure 514.8C-5 and Table 514.8C-V).
|
MIL-STD-810H METHOD 514.8, ANNEX C
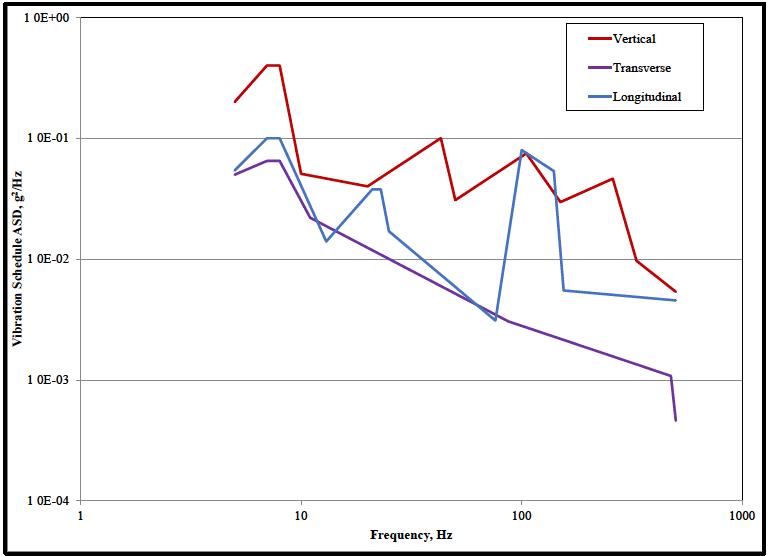
Figure description:
Vibration Schedule ASD
Vibration Schedule ASD vs. Frequency
Legend
- Vertical — color: red; symbol: Solid line
- Transverse — color: purple; symbol: Solid line
- Longitudinal — color: blue; symbol: Solid line
| Frequency (Hz) | Vertical (g²/Hz) | Transverse (g²/Hz) | Longitudinal (g²/Hz) |
|---|---|---|---|
| 5 | 0.2 | 0.052 | 0.056 |
| 7 | 0.4 | null | 0.1 |
| 8 | 0.4 | 0.066 | 0.1 |
| 8.5 | null | null | 0.1 |
| 10 | 0.052 | null | null |
| 11 | null | 0.024 | null |
| 13 | null | null | 0.014 |
| 20 | 0.04 | null | null |
| 22 | null | null | 0.038 |
| 25 | null | null | 0.038 |
| 27 | null | null | 0.017 |
| 45 | 0.1 | null | null |
| 50 | 0.031 | null | null |
| 75 | null | 0.0032 | 0.0032 |
| 100 | 0.075 | null | 0.08 |
| 140 | null | null | 0.055 |
| 150 | 0.03 | null | 0.0056 |
| 280 | 0.046 | null | null |
| 350 | 0.01 | null | null |
| 480 | null | 0.0011 | null |
| 500 | 0.0055 | 0.00046 | 0.0047 |
Notes: The axes for both Frequency and Vibration Schedule ASD are logarithmic. Data points are estimated based on visual interpretation of the log scales.
Figure 514.8C-4. - Category 4 - Composite two-wheeled trailer vibration exposure.
| Vertical | Transverse | Longitudinal | |||
|---|---|---|---|---|---|
| Frequency, Hz | ASD, g²/Hz | Frequency, Hz | ASD, g²/Hz | Frequency, Hz | ASD, g²/Hz |
| 5 | 0.20000 | 5 | 0.05000 | 5 | 0.05418 |
| 7 | 0.40000 | 7 | 0.06500 | 7 | 0.10000 |
| 8 | 0.40000 | 8 | 0.06500 | 8 | 0.10000 |
| 10 | 0.05090 | 11 | 0.02200 | 13 | 0.01400 |
| 20 | 0.04000 | 87 | 0.00306 | 21 | 0.03780 |
| 43 | 0.10036 | 475 | 0.00108 | 23 | 0.03780 |
| 50 | 0.03079 | 500 | 0.00046 | 25 | 0.01700 |
| 105 | 0.07500 | 76 | 0.00310 | ||
| 150 | 0.02964 | 100 | 0.08000 | ||
| 259 | 0.04636 | 140 | 0.05354 | ||
| 332 | 0.00970 | 155 | 0.00551 | ||
| 500 | 0.00537 | 500 | 0.00456 | ||
| rms = 3.98 g | rms = 1.22 g | rms = 2.52 g | |||
MIL-STD-810H METHOD 514.8, ANNEX C
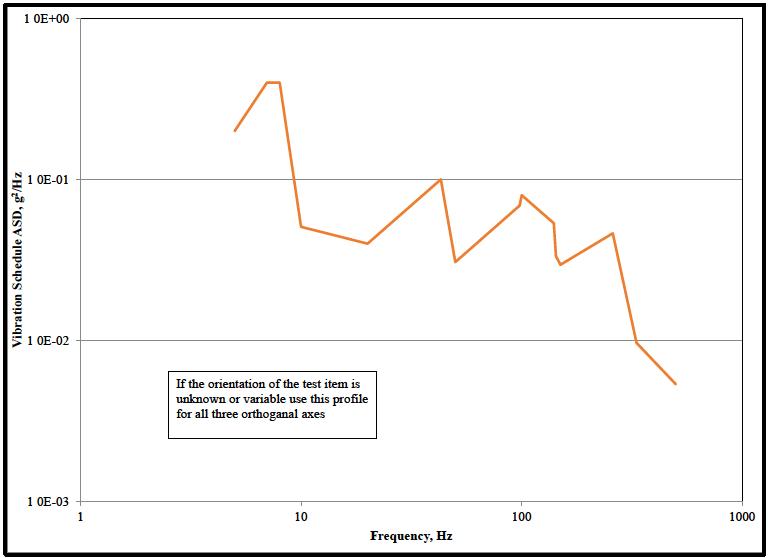
Figure description:
Vibration Schedule Profile Vibration profile for test item orientation
Vibration Schedule ASD vs. Frequency
Annotations
- If the orientation of the test item is unknown or variable use this profile for all three orthogonal axes (text_label - position: Centered at approximately x=25 Hz, y=0.005 g²/Hz)
| Frequency (Hz) | Vibration Schedule ASD (g²/Hz) |
|---|---|
| 5 | 0.2 |
| 7 | 0.4 |
| 8 | 0.4 |
| 10 | 0.05 |
| 20 | 0.04 |
| 43 | 0.1 |
| 48 | 0.03 |
| 100 | 0.08 |
| 140 | 0.055 |
| 145 | 0.03 |
| 260 | 0.045 |
| 320 | 0.01 |
| 500 | 0.005 |
Notes: The data is plotted on a log-log scale. Coordinates of vertices are estimated based on visual alignment with the log grid. Significant points on grid lines: (10, 0.05, (43, 0.1, (100, 0.08, (320, 0.01.))))
Figure 514.8C-5.- Category 4 – Composite two-wheeled trailer vibration exposure for unknown orientation.
| V, L&T Envelope | |
|---|---|
| Frequency, Hz | ASD, g²/Hz |
| 5 | 0.20000 |
| 7 | 0.40000 |
| 8 | 0.40000 |
| 10 | 0.05090 |
| 20 | 0.04000 |
| 43 | 0.10036 |
| 50 | 0.03079 |
| 98 | 0.06910 |
| 100 | 0.08000 |
| 140 | 0.05354 |
| 143 | 0.03350 |
| 150 | 0.02964 |
| 259 | 0.04636 |
| 332 | 0.00970 |
| 500 | 0.00537 |
| rms = 4.03 g | |
(2) Composite wheeled vehicle (CWV). Exposures are shown in Figure 514.8C-6, and are followed by the respective data table (Table 514.8C-VII). If the orientation of the test item is unknown or variable, see exposure levels shown in Figure 514.8C-7 and Table 514.8C-VIII. (See paragraph 6.1, references pp to vv.)
Test Schedule: Secured Cargo - Composite Wheeled Vehicle
Vehicles Used for Composite: Measured vibration data from the following vehicles (Table 514.8C-VI) were used to develop the Composite Wheeled Vehicle test schedule:
| NOMENCLATURE | DESCRIPTION |
|---|---|
| M985 | US Heavy Expanded Mobility Tactical Truck (HEMTT) 10-ton truck |
| MK27* | US Medium Tactical Vehicle Replacement (MTVR) 7-ton truck |
| M1083/M1084/M1085 | US Medium Tactical Vehicle (MTV) 5-ton truck |
| M1151**/M1152/M1113 | US High Mobility Multipurpose Wheeled Vehicle (HMMWV) 1-1/4-ton truck |
| M1074/M1075 | US Palletized Loading System (PLS) truck |
| M1078*** | US Light MTV 2-1/2-ton truck |
| MTVR-T* | US MTVR trailer |
| M989**** | US Heavy Expanded Mobility Trailer (HEMAT) |
| M1076 | US PLS trailer |
| M1095 | US MTV 5-ton trailer |
| M1082*** | US Light MTV 2-1/2-ton trailer |
| M871A3***** | US 22-ton semitrailer |
| Unimog | German 2-ton truck |
| Machine Fabrik Augsburg Nurnberg (MAN) | German 5-, 7-, 10-, 15-ton trucks |
| * | 2 measurement locations |
| ** | 6 measurement locations |
| *** | 8 measurement locations |
| **** | 4 measurement locations |
| ***** 12 measurement locations | |
Measured Locations: 9 locations on frame under cargo bed (3X3 matrix) except as noted in the table above
Type of Test Load: Sand filled ammo boxes (or other similar cargo) were secured to the cargo bed, and loaded to 3/4 of vehicle rated load.
Scenario to be Simulated: 805 km (500 mi) from the port staging area to the forward supply point described as follows: The typical mission/field transport scenario starts at the port staging area (PSA). The movement prior to this point would include transport by commercial common carrier, military long range aircraft, ship, and/or railroad. This movement would occur over improved road surfaces or in platforms that have been proven to impose significantly lower vibration levels than those vehicles used for transport from the port staging area to the using unit. The typical scenario has established that 805 km of transport are expected between the PSA and the forward supply point (FSP). This transport is in trucks and/or semitrailers. The road surfaces will be paved, secondary, and cross country.
MIL-STD-810H
METHOD 514.8, ANNEX C
Assumptions (Scenario, Load, Failure Mechanism, etc.):
Total Mission of 805 km (500 miles) is accounted for as follows:
- • 35 percent of total mission, 282 km (175 miles), is on-road and considered benign compared to the off-road environment.
- • 65 percent of total mission, 523 km (325 miles), is off-road:
- One-third of the off-road environment, 174 km (108 miles), is rough terrain consistent with the Belgian Block, Two-Inch Washboard, Radial Washboard, and Three-Inch Spaced Bump courses used to collect data. Average Speed over these courses was 26 km/hr (16 mph).
- Two-thirds of the off-road environment, 349 km (217 miles), is considered benign compared to the test conditions described above.
Failure mode: fatigue
Test Time Compression: Test time was computed from:
Where: = equivalent test time = in-service time for specified condition = ASD at test condition, = ASD at in-service condition, = 7.5 (see paragraph 2.2 of Annex A for further explanation)
Test Time: 40 minutes per axis
Exaggeration Factor:
Method of Combination of Spectra: A statistical method, as described in Annex F, Appendix C, was used to create the spectra for the individual vehicles in Table 514.8C-VI. This method makes use of the spectral variance from different measurement locations and test conditions and produces a spectrum that is a very conservative estimate of the actual measured environments. This procedure produced an ASD for each vehicle in each of the orthogonal axes. The composite wheeled vehicle spectrum was created by applying the upper normal one-sided tolerance limit to the spectrum data. The upper normal one-sided tolerance limit is based on two values, and . For these data was set to 0.90 and was set to 0.50. This means that one is 50 percent confident that 90 percent of the vibration profiles of all wheeled cargo vehicles will fall below the composite wheeled vehicle vibration schedules presented below. The upper normal one- sided tolerance limit is described more fully in Annex F, Appendix B, paragraph 2.3.
- Location of Control Accelerometer(s): 2 accelerometers at opposite corners, within 30 cm (12 in.) from test item
- Recommended Control Scheme: Average (Extremal control may be appropriate for some applications). Based on the field data characteristics and the conservatism associated with the composite vehicle VSD process, drive limiting to 3 sigma is recommended.
For movement direction definitions, see paragraph 4.4 in the front part of this Method.
MIL-STD-810H METHOD 514.8, ANNEX C
RMS Acceleration:1,3 (G-rms): Vertical – 2.24; Transverse – 1.45; Longitudinal – 1.32; Envelope – 2.24.
Velocity (in/sec) (peak single amplitude): 1,3
Vertical 28.76; Transverse 17.83; Longitudinal 12.75; Envelope - 28.76.
Displacement (in) (peak double amplitude): 1,2,3 Vertical – 1.22; Transverse – 0.73; Longitudinal – 0.51; Envelope – 1.22.
^1 Approximate values for a Gaussian random distribution which may vary based on the control system and spectral resolution. Peak velocity and displacement values are based on an acceleration maximum of three times the standard deviation (3σ) and a spectral resolution of 1 Hz.
2 For shaker systems that are incapable of the displacement requirements of this schedule, minor adjustments may be made to the low frequency ASD values within the tolerances specified in 4.2.2.1a (main body) to accommodate the shaker limitations. If any schedule needs to be modified, make sure that all parties involved (tester, customer, etc.) are aware of the reason for the changes, and agree to the changes prior to test. Ensure an adequate test is performed and all deviations from the published schedules are properly documented.
3 For test items for which the test item orientation is unknown or variable the Envelope profile should
³For test items for which the test item orientation is unknown or variable the Envelope profile should be run for all three axes (Figure 514.8C-7 and Table 514.8C-VIII).
|
MIL-STD-810H METHOD 514.8, ANNEX C
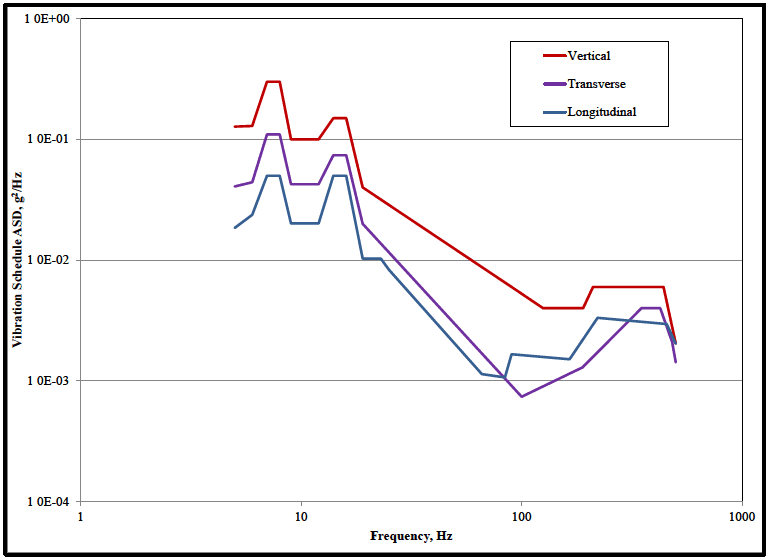
Figure description:
Vibration Schedule ASD vs Frequency (Log-Log Plot Analysis
Vibration Schedule ASD vs Frequency
Legend
- Vertical — color: red; symbol: Thick solid line
- Transverse — color: purple; symbol: Medium solid line with triangle marker
- Longitudinal — color: blue; symbol: Thin solid line with diamond marker
| Frequency (Hz) | Vertical (g²/Hz) | Transverse (g²/Hz) | Longitudinal (g²/Hz) |
|---|---|---|---|
| 5 | 1.30E-01 | 4.10E-02 | 1.90E-02 |
| 6 | 1.30E-01 | 4.50E-02 | 2.50E-02 |
| 7 | 3.00E-01 | 1.10E-01 | 5.00E-02 |
| 8 | 3.00E-01 | 1.10E-01 | 5.00E-02 |
| 9 | 1.00E-01 | 4.20E-02 | 2.10E-02 |
| 12 | 1.00E-01 | 4.20E-02 | 2.10E-02 |
| 14 | 1.50E-01 | 7.50E-02 | 5.00E-02 |
| 16 | 1.50E-01 | 7.50E-02 | 5.00E-02 |
| 19 | 4.00E-02 | 2.00E-02 | 1.00E-02 |
| 25 | null | null | 1.00E-02 |
| 65 | null | null | 1.10E-03 |
| 75 | null | null | 1.10E-03 |
| 85 | null | null | 1.70E-03 |
| 100 | null | 7.50E-04 | null |
| 125 | 4.00E-03 | null | null |
| 170 | null | null | 1.50E-03 |
| 200 | 4.00E-03 | 1.30E-03 | null |
| 220 | 6.00E-03 | null | null |
| 230 | null | null | 3.30E-03 |
| 400 | null | 4.00E-03 | null |
| 450 | 6.00E-03 | 4.00E-03 | 3.00E-03 |
| 500 | 2.00E-03 | 1.40E-03 | 2.00E-03 |
Figure 514.8C-6. - Category 4 - Composite wheeled vehicle vibration exposure.
| Vertical | Transverse | Longitudinal | |||
|---|---|---|---|---|---|
| Frequency, Hz | ASD, g²/Hz | Frequency, Hz | ASD, g²/Hz | Frequency, Hz | ASD, g²/Hz |
| 5 | 0.12765 | 5 | 0.04070 | 5 | 0.01848 |
| 6 | 0.12926 | 6 | 0.04415 | 6 | 0.02373 |
| 7 | 0.30000 | 7 | 0.11000 | 7 | 0.05000 |
| 8 | 0.30000 | 8 | 0.11000 | 8 | 0.05000 |
| 9 | 0.10000 | 9 | 0.04250 | 9 | 0.02016 |
| 12 | 0.10000 | 12 | 0.04250 | 12 | 0.02016 |
| 14 | 0.15000 | 14 | 0.07400 | 14 | 0.05000 |
| 16 | 0.15000 | 16 | 0.07400 | 16 | 0.05000 |
| 19 | 0.04000 | 19 | 0.02000 | 19 | 0.01030 |
| 90 | 0.00600 | 100 | 0.00074 | 23 | 0.01030 |
| 125 | 0.00400 | 189 | 0.00130 | 25 | 0.00833 |
| 190 | 0.00400 | 350 | 0.00400 | 66 | 0.00114 |
| 211 | 0.00600 | 425 | 0.00400 | 84 | 0.00107 |
| 440 | 0.00600 | 482 | 0.00210 | 90 | 0.00167 |
| 500 | 0.00204 | 500 | 0.00142 | 165 | 0.00151 |
| 221 | 0.00333 | ||||
| 455 | 0.00296 | ||||
| 500 | 0.00204 | ||||
| rms = 2.24 g | rms = 1.45 g | rms = 1.32 g | |||
MIL-STD-810H METHOD 514.8, ANNEX C
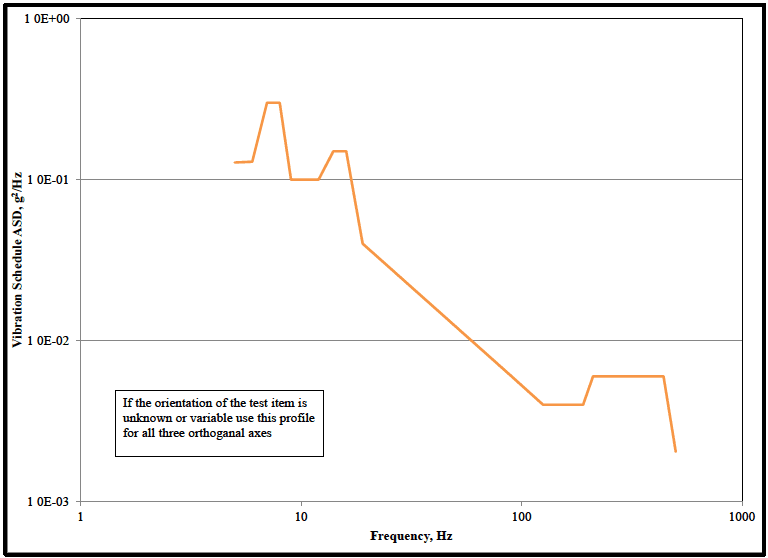
Figure description:
Vibration Schedule ASD vs Frequency
Annotations
- If the orientation of the test item is unknown or variable use this profile for all three orthogonal axes (text_label - position: Center-left in the bottom half of the chart, roughly x=5 to 20, y=0.003 to 0.007)
| Frequency (Hz) | Vibration Schedule ASD (g²/Hz) |
|---|---|
| 5 | 0.13 |
| 6 | 0.13 |
| 7 | 0.30 |
| 8 | 0.30 |
| 9 | 0.10 |
| 12 | 0.10 |
| 14 | 0.15 |
| 16 | 0.15 |
| 19 | 0.04 |
| 130 | 0.004 |
| 200 | 0.004 |
| 220 | 0.006 |
| 450 | 0.006 |
| 500 | 0.002 |
Notes: The chart is a log-log plot. Values are estimated from the provided logarithmic scales on both axes.
Figure 514.8C-7. - Category 4 - Composite wheeled vehicle vibration exposure for unknown orientation.
| Envelope | |
|---|---|
| Frequency, Hz | ASD, g²/Hz |
| 5 | 0.12765 |
| 6 | 0.12926 |
| 7 | 0.30000 |
| 8 | 0.30000 |
| 9 | 0.10000 |
| 12 | 0.10000 |
| 14 | 0.15000 |
| 16 | 0.15000 |
| 19 | 0.04000 |
| 90 | 0.00600 |
| 125 | 0.00400 |
| 190 | 0.00400 |
| 211 | 0.00600 |
| 440 | 0.00600 |
| 500 | 0.00204 |
| rms = 2.24 g | |
514.8C -XIVb. Category 9 - Helicopter vibration exposure. (Same as Annex D, Table 514.8D-IIIb.)
| MATERIEL | RANDOM LEVELS | SOURCE FREQUENCY (fx) RANGE (Hz) | PEAK ACCELERATION (Ax) at fx (GRAVITY UNITS (g)) |
|---|---|---|---|
| General | W0 = 0.0010 g²/Hz W1 = 0.010 g²/Hz ft = 500 Hz | 3 to 10 | 0.70/(10.70 - fx) |
| 10 to 25 | 0.10 x fx | ||
| 25 to 40 | 2.50 | ||
| 40 to 50 | 6.50 - 0.10 x fx | ||
| 50 to 500 | 1.50 | ||
| Instrument Panel | W0 = 0.0010 g²/Hz W1 = 0.010 g²/Hz ft = 500 Hz | 3 to ≤ 10 | 0.70/(10.70 - fx) |
| >10 to 25 | 0.070 x fx | ||
| 25 to 40 | 1.750 | ||
| 40 to 50 | 4.550 - 0.070 x fx | ||
| 50 to 500 | 1.050 | ||
| External Stores | W0 = 0.0020 g²/Hz W1 = 0.020 g²/Hz ft = 500 Hz | 3 to ≤ 10 | 0.70/(10.70 - fx) |
| >10 to 25 | 0.150 x fx | ||
| 25 to 40 | 3.750 | ||
| 40 to 50 | 9.750 - 0.150 x fx | ||
| 50 to 500 | 2.250 | ||
| On/Near Drive System Elements | W0 = 0.0020 g²/Hz | 5 to ≤ 50 | 0.10 x fx |
| W1 = 0.020 g²/Hz ft = 2000 Hz | > 50 to 2000 | 5.0 + 0.010 x fx |
| Main or Tail Rotor Frequencies (Hz) Determine 1P and 1T from the Specific Helicopter or from the table (below). | Drive Train Component Rotation Determine 1S from Specific Helicopter and Component. | |||
|---|---|---|---|---|
| f1 = 1P | f1 = 1T | f1 = 1S | ||
| f1 = 1P | f1 = 1T | fundamental | f1 = 1S | fundamental |
| f2 = n x 1P | f2 = m x 1T | blade passage (BP) | f2 = 2 x 1S | 2nd harmonic |
| f3 = 2 x n x 1P | f3 = 2 x m x 1T | 2nd harmonic | f3 = 3 x 1S | 3rd harmonic |
| f4 = 3 x n x 1P | f4 = 3 x m x 1T | 3rd harmonic | f4 = 4 x 1S | 4th harmonic |