525.2-3 DESCRIPTION OF REFERENCE TIME TRACE
The time trace selected for illustration is one unidentified band limited field measured acceleration time trace used to assess the performance of the vendor software for a single axis exciter configuration. Test item configuration including fixturing was of no concern. The simplicity of the TWR test provides for replication error that is smaller than that encountered in general testing scenarios where boundary conditions and impedance mismatches become important. Figure 525.2A-1 displays the unprocessed reference time trace acceleration measured in the field.
MIL-STD-810H METHOD 525.2 ANNEX A
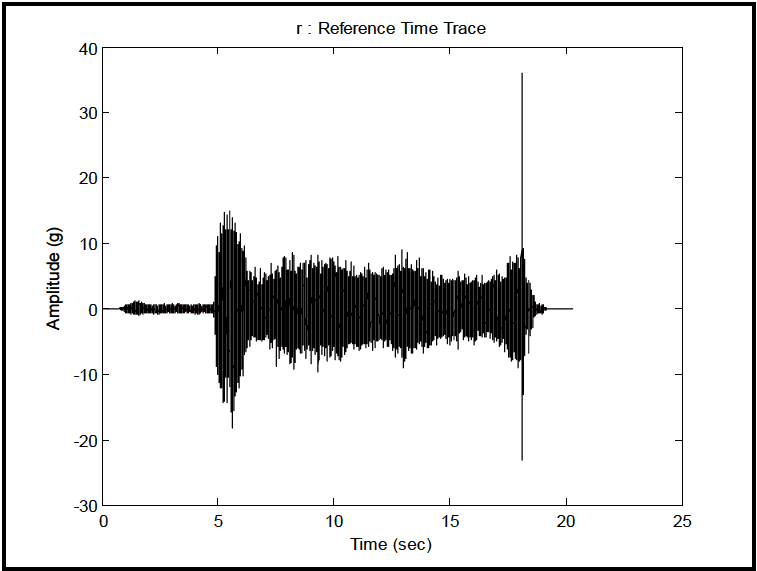
Figure description:
r : Reference Time Trace
r : Reference Time Trace
| Time (sec) | Amplitude (g) |
|---|---|
| 0.0 | 0.0 |
| 0.8 | 0.0 |
| 1.0 | 0.5 |
| 1.2 | 1.3 |
| 1.5 | -1.5 |
| 1.8 | 0.8 |
| 2.2 | 0.0 |
| 4.5 | 0.0 |
| 4.8 | 0.0 |
| 5.0 | 10.0 |
| 5.2 | -13.0 |
| 5.4 | 14.8 |
| 5.6 | -18.0 |
| 5.8 | 15.0 |
| 6.0 | -14.0 |
| 6.2 | 11.5 |
| 6.5 | 4.5 |
| 7.0 | -6.5 |
| 8.0 | 8.5 |
| 9.0 | -8.5 |
| 10.0 | 8.0 |
| 11.0 | -9.5 |
| 12.0 | 8.0 |
| 13.0 | -9.0 |
| 14.0 | 9.0 |
| 15.0 | -7.5 |
| 16.0 | 6.5 |
| 17.0 | -8.0 |
| 17.5 | 8.5 |
| 17.8 | -11.0 |
| 18.0 | 36.2 |
| 18.1 | -23.1 |
| 18.3 | 9.0 |
| 18.5 | -5.5 |
| 19.0 | 1.0 |
| 19.5 | 0.0 |
| 20.0 | 0.0 |
| 25.0 | 0.0 |
Notes: The chart represents a time-history of acceleration in g's. It features a quiescent period, followed by two small bursts, a sustained high-amplitude vibration starting around 5 seconds, and a singular high-magnitude impulse event at approximately 18 seconds before returning to zero.
Figure 525.2A-1. Field measured acceleration reference time trace.
The time trace is band limited between 1 Hz and 2000 Hz, and consists of an initial and final low level stationary random vibration (augmented with some analytically generated zeros), along with a form of comparatively high level transient vibration, stationary random vibration and shock in succession. This visual assessment of the reference time trace is a key to examining the test performance adequacy. Under standard vendor vibration and shock system software, it would not be possible to test materiel to this form of time trace. The time trace was submitted for TWR testing under ambient conditions on an electrodynamic exciter using a vendor-supplied TWR software package. The “control accelerometer” was mounted on both the exciter head and on a conventional slip table. Even though TWR “control” is between 10 Hz and 2000 Hz, the sample rate of the reference time trace ASCII file is 25600 samples per second. The particular TWR vendor software re-sampled the waveforms to 24576 samples per second prior to testing. The Nyquist frequency is 24576/2=12288 Hz. Most frequency domain plots will be restricted to 4000 Hz, and basic TWR control is out to 2000 Hz. The field measured time trace should display a bandwidth that exceeds the TWR control bandwidth to as much as an octave above and below the upper and lower control bandwidth limits, respectively. For demonstration of the effect of different boundary conditions, results of the testing will be displayed for the control time trace from the exciter head (designated (H)) and the exciter slip table (designated (S)).
525.2-3 REPLICATION ERROR (TEST TOLERANCE) ASSESSMENT EXPRESSIONS
For replication error assessment, it may be useful to nonuniformly time weight or “window” s(t) over a time interval before making error estimates but the rationale for such weighting is beyond the scope of discussion here . For the replication error assessment to follow, two options are available:
(1) examining the statistical properties of sequence S directly in an overall or “global” sense
- (2) examining sequence S under “short-time averaging” (STA) yielding stochastic variable SA for statistical assessment where SA represents a “local” average and the total set of “local” averages summarizes S
The stochastic estimates SA have bias error and random error, but it is assumed that judicious selection of the “window”
has representative random error and minimum bias error.
The time averaging procedure can be applied to functions of s(t) such as the instantaneous mean-square level of s(t),
our time averaging procedure to applied to functions of such as the instantaneous mean square error , i.e., . In using STA for replication error assessment, the summary statistics need to be clearly defined, and any note made of dependence introduced in the averaging process e.g., serial correlation of shifted average values.
Since it is assumed that for the expectation operator on stochastic variables and , then .
Replication error assessment precedes TWR tolerance specification, however replication error assessment must relate directly to tolerance specification. For example, tolerance specification for TWR is not viable for “single point” error assessment i.e., maximum of S but maximum of S may be a meaningful parameter. In addition the deterministic reference, R, is generally oversampled by a factor of ten or more based upon TWR requirements. It is safe to assume that a “nominal window” for error assessment could be a uniform time interval with the number of points equal the oversample factor. This implies that “smoothed” error estimates applied to sequence S are fundamental in replication error assessment and subsequent tolerance specification. As noted above generally the smoothing window should not exceed the vendor control blocksize. The oversample factor and this blocksize provide bounds on STA averaging time selection.
[
]
In the expressions to follow, processing will take place over a uniform time interval . Formulas provided will be expressed in a continuous form followed by a discrete digital form. In general, the error statistics for the estimators will be provided for the ideal case in which is bandwidth limited white noise of bandwidth . The role the error statistics for the estimators play is to insure that artificial estimation errors in replication error assessment are minimal when compared to the replication errors to be used in tolerance specification. As mentioned above, seldom is the character of so simple, so that the processing error statistics are approximate for other than bandwidth limited white noise. Normalized random errors are provided for most estimates. Bias error occurs whenever averaging takes
MIL-STD-810H
METHOD
3.1 Pretest
The following information is required to conduct and document TWR tests adequately. Tailor the lists to the specific circumstances, adding or deleting items as necessary.
- a. General. Information listed in Part One, paragraphs 5.7 and 5.9; and Part One, Annex A, Task 405 of this Standard.
- b. Specific to this Method.
- (1) Test system (test item/platform configuration) detailed information including:
- (a) Control sensor location for control time trace (for single axis testing this will be a point near the original reference measurement point).
- (b) Reference time trace to be replicated (stored on the TWR control system disk).
- (c) Monitor sensor locations (if any).
- (d) Test bandwidth and preprocess reference time trace as required.
- (e) Levels of pre-test acceptable to obtain appropriate exciter system compensation.
- (f) Criteria for satisfaction of the test including TWR tolerance limits related to the reference time trace and the control time trace(s).
- (2) Ability of overall system to replicate the time trace under TWR including band-limited input and the temperature effects (if any). For the application of more than one time trace, the individual time traces must be separated at time intervals that allow the test item to assume a pre-test dynamic condition (unless this is contrary to the requirements of the LCEP). Impedance mismatches and boundary conditions are important for assessing the ability to execute a successful TWR test.
- c. Tailoring. Necessary variations in the basic test procedures to accommodate LCEP requirements and/or facility limitations.
3.2 During Test
Collect the following information while conducting the test:
- a. General. Information listed in Part One, paragraph 5.10; and in Part One, Annex A, Tasks 405 and 406 of this Standard.
- b. Specific to this Method.
- (1) Capture of the control time trace in digital form for comparison with the reference time trace.
- (2) Capture of the monitor time traces in digital form.
- (3) Recording of the number of individual test events and order for application.
- (4) Log of auxiliary environmental conditions such as temperature.
- (5) Log of materiel functional failure.
3.3 Post-Test
The following post test data shall be included in the test report.
- a. General. Information listed in Part One, paragraph 5.13, and in Annex A; Tasks 405 and 406 of this Standard.
- b. Specific to this Method.
- (1) Number of exposures of the test item to the time trace(s) and the order if several dissimilar time traces are used in test.
- (2) Any data measurement anomalies, e.g., high instrumentation noise levels, loss of sensor response.
- (3) Status of the test item/fixture. In particular, any structural or functional failure of the test item/fixture.
MIL-STD-810H
METHOD 525.2
- (4) Status of measurement system after each test.
- (5) Any variations from the original test plan.