| Configuration | Factors | Configuration | Factors | ||
|---|---|---|---|---|---|
| Aerodynamically clean | A1 | A2 | B1 | B2 | |
| Single store | 1 | 1 | Powered missile, aft half | 1 | 4 |
| Side by side stores | 1 | 2 | Other stores, aft half | 1 | 2 |
| Behind other store(s) | 2 | 4 | All stores, forward half | 1 | 1 |
| Aerodynamically dirty 8/ | C1 | C2 | D1 | D2 | |
| Single and side by side | 2 | 4 | Field assembled sheet metal fin/tail cone unit | 8 | 16 |
| Behind other store(s) | 1 | 2 | |||
| Other stores | 1 | 1 | Powered missile | 1 | 1 |
| E1 | E2 | Other stores | 4 | 4 | |
| Jelly filled firebombs | 1/2 | 1/4 | |||
| Other stores | 1 | 1 | |||
M - Mach number. H - (metric units) ( English units). C - (metric units) ( English units). q - Flight dynamic pressure (see Table 514.8D-V) – . - Store weight density (weight/volume) - . Limit values of to . t - Average thickness of structural (load carrying) skin - m (in). R - Store characteristic (structural) radius m (in) (Average over store length). Store radius for circular cross sections. Half or major and minor diameters for elliptical cross section. Half or longest inscribed chord for irregular cross sections.
1/ - When store parameters fall outside limits given, consult references. 2/ - Mach number correction (see Annex B). 3/ - Limit f₁ to 100 ≤ f₁ ≤ 2000 Hz 4/ - Free fall stores with tail fins, f₁ = 125 Hz 5/ - Limit length ratio to: 0.0010 ≤ C ( t / R² ) ≤ 0.020 6/ - f₀ = 500 Hz for cross sections not circular or elliptical 7/ - If f₀ ≥ 1200 Hz, then use f₀ = 2000 Hz 8/ - Configurations with separated aerodynamic flow within the first ¼ of the store length. Blunt noses, optical flats, sharp corners, and open cavities are some potential sources of separation. Any nose other than smooth, rounded, and gently tapered is suspect. Aerodynamics engineers should make this judgment.
| Representative parameter values | ||||||
|---|---|---|---|---|---|---|
| Store type | Max q | ρ | f1 | f2 | ||
| kN/m2 | (lb/ft2) | kg/m3 | (lb/ft3) | Hz | Hz | |
| Missile, air to ground | 76.61 | (1600) | 1602 | (100) | 500 | 1500 |
| Missile, air to air | 76.61 | (1600) | 1602 | (100) | 500 | 1500 |
| Instrument pod | 86.19 | (1800) | 801 | (50) | 500 | 1500 |
| Dispenser (reusable) | 57.46 | (1200) | 801 | (50) | 200 | 1200 |
| Demolition bomb | 57.46 | (1200) | 1922 | (120) | 125 | 1100 |
| Fire bomb | 57.46 | (1200) | 641 | (40) | 100 | 1100 |
MIL-STD-810H METHOD 514.8, ANNEX D
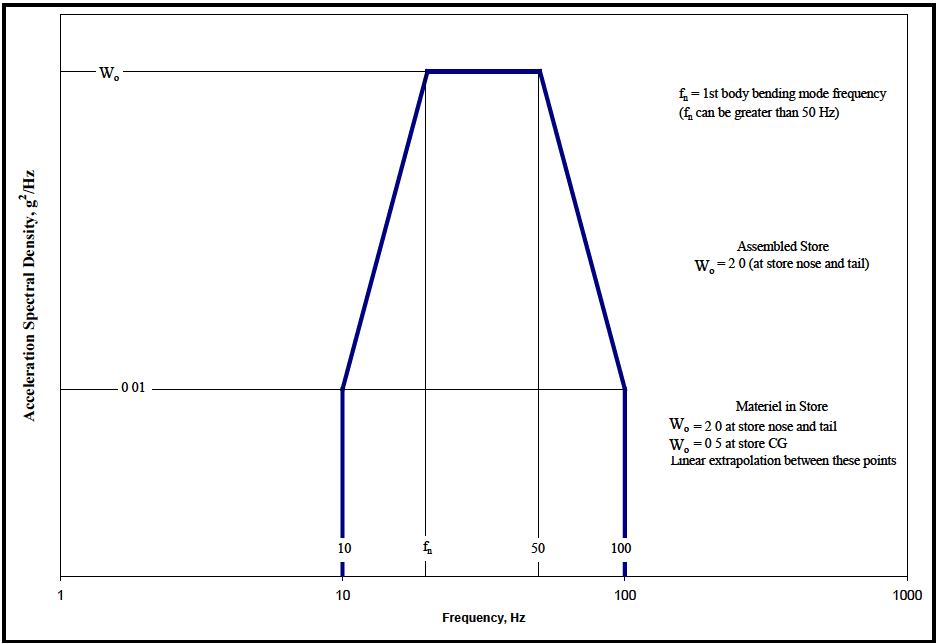
Figure description:
Acceleration Spectral Density vs. Frequency
Acceleration Spectral Density Vibration Profile
Annotations
- = 1st body bending mode frequency () can be greater than 50 Hz (text_label - position: top right region)
- Assembled Store (at store nose and tail (text_label - position: center right region))
- Materiel in Store: at store nose and tail; at store CG; Linear extrapolation between these points (text_label - position: bottom right region)
- (text_label - position: y-axis at peak level)
- 0.01 (text_label - position: y-axis at base level)
| Frequency (Hz) | Acceleration Spectral Density (g²/Hz) |
|---|---|
| 10 | 0 |
| 10 | 0.01 |
| 50 | |
| 100 | 0.01 |
| 100 | 0 |
Notes: The chart represents a generalized vibration profile with frequency plotted on a logarithmic scale. The key parameters and are defined by the specific configuration and location within the store as described in the annotations.
Figure 514.8D-7. Category 15 - Jet aircraft store buffet response.
514.8D -V. Dynamic pressure calculation
(See Annex A, paragraph 2.6.2 for definitions and details)
- Dynamic pressure calculation valid only for Mach numbers less than 1.0 (one).
- Mach number may be used at any airspeed.
- Unless specifically stated otherwise, assume airspeeds to be in calibrated airspeed (Kcas).
- When airspeed values are given as indicated airspeed (Kias), assume Kias equal Kcas.
- Altitude (h) is pressure altitude and not height above terrain.
| h≤11000 m | 11000<h≤20056 m | (h≤36089 ft) | 36089<h<65800 ft | |
|---|---|---|---|---|
| θ | 1-2.2556×10⁻⁵ h | 0.75189 | 1-6.8750×10⁻⁶× h | 0.75189 |
| δ | θ5 2561 | 0.2234 eφ | θ5 2561 | 0.2234 eφ |
| Va | Vao X θ1/2 | 295.06 | Vao X θ1/2 | 968.03 |
| σ | θ 4.2561 | 0.2971 eφ | θ 4.2561 | 0.2971 eφ |
| Φ | ----- | (11000-h)/6342.0 | ----- | (36089-h)/20807 |
| ρo | 1.2251 × 10⁻³ | 1.2251 × 10⁻³ | 2.377 × 10⁻³ | 2.377 × 10⁻³ |
| Vao | 340.28 | ----- | 1116.4 | ----- |
| To | 288.16°K | ----- | 518.69°R | ----- |
| Vcas - Calibrated airspeed, m/sec (ft/sec) | ρo - Sea level atmospheric density kg/m³ (slugs/ft³ or lb sec²/ft4) | |||
| Vias - Indicated airspeed, m/sec (ft/sec) | ||||
| Veas - Equivalent airspeed, m/sec (ft/sec) | δ - Ratio of local atmospheric pressure to sea level atmospheric pressure | |||
| Vtas - True airspeed, m/sec (ft/sec) (Vtas =Veas =Vcas = Vias at sea level) | ||||
| Vao - Sea level speed of sound, m/sec (ft/sec) | σ - Ratio of local atmospheric density to sea level atmospheric density (standard atmosphere) | |||
| Va - Local speed of sound, m/sec (ft/sec) | ||||
| M - Mach number | ||||
| q - Dynamic pressure, kN/m² (lb/ft²) | θ - Ratio of temperature at altitude to sea level temperature (standard atmosphere) | |||
| h - Pressure altitude, m (ft), (standard atmosphere) | ||||
| To - Sea level atmospheric temperature °K (°R) | Φ - Stratospheric altitude variable | |||
Airspeeds are typically expressed in knots as follows: V_kcas - knots calibrated air speed V_kias - knots indicated air speed V_keas - knots equivalent air speed V_ktas - knots true air speed [ knots = nautical miles per hour ( knots x 0.51478 = m/sec)( knots x 1.6889 = ft/sec) ]
| Calculation Examples | ||||||||
|---|---|---|---|---|---|---|---|---|
| Airspeed | Pressure Altitude - h | |||||||
| 1500m | (4921 ft) | 3048m | (10000 ft) | 7000m | (22966 ft) | 10668m | (35000 ft) | |
| kN/m2 | lb/ft2 | kN/m2 | lb/ft2 | kN/m2 | lb/ft2 | kN/m2 | lb/ft2 | |
| 500 Vkcas | q=39.6 | q=827 | q=38.5 | q=803 | NA (M>1) | NA (M>1) | ||
| 500 Vktas | q=35.0 | q=731 | q=29.9 | q=625 | q=19.5 | q=407.2 | q=12.5 | q=262 |
| M=0.8 | q=37.9 | q=791.6 | q=31.2 | q=652 | q=18.4 | q=384.2 | q=10.7 | q=223 |
| 300 Vkeas | q=14.5 | q=302.8 | q=14.6 | q=304 | q=14.6 | q=304.9 | q=14.6 | q=304 |
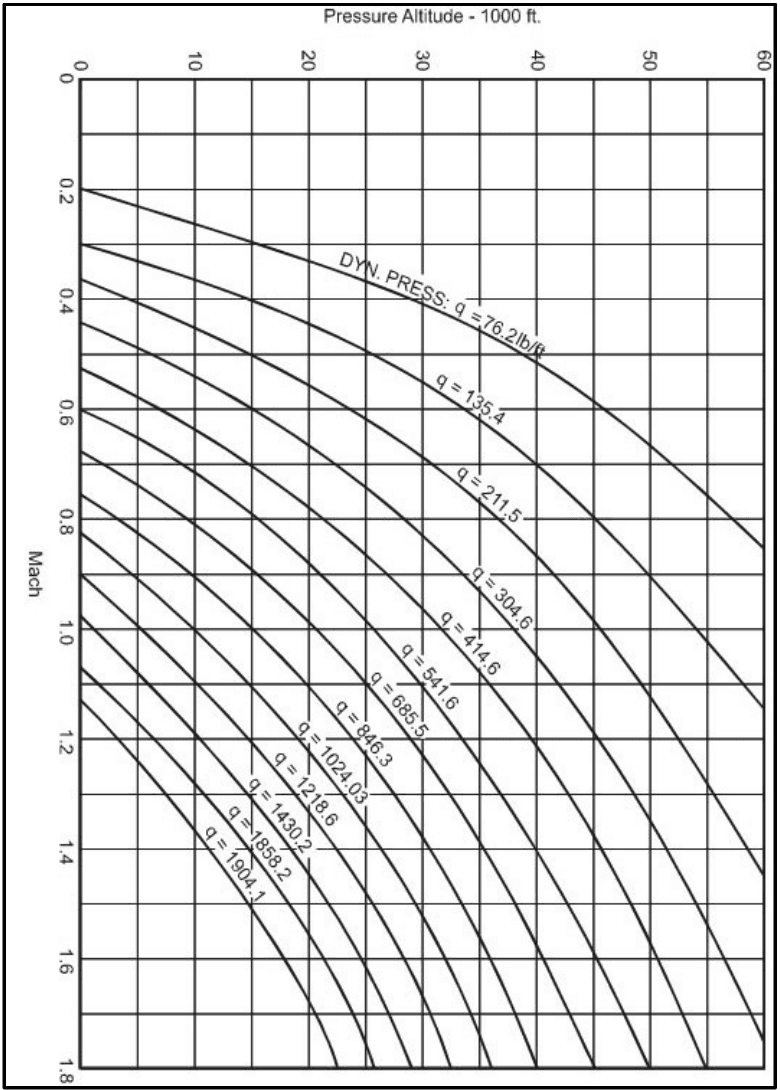
Figure description:
Dynamic Pressure Nomogram Charting Mach vs Altitude
Mach vs. Pressure Altitude for Constant Dynamic Pressure (q
Legend
- q = 76.2 — color: black; symbol: Solid line
- q = 135.4 — color: black; symbol: Solid line
- q = 211.5 — color: black; symbol: Solid line
- q = 304.6 — color: black; symbol: Solid line
- q = 414.6 — color: black; symbol: Solid line
- q = 541.6 — color: black; symbol: Solid line
- q = 685.5 — color: black; symbol: Solid line
- q = 846.3 — color: black; symbol: Solid line
- q = 1024.03 — color: black; symbol: Solid line
- q = 1218.6 — color: black; symbol: Solid line
- q = 1430.2 — color: black; symbol: Solid line
- q = 1658.2 — color: black; symbol: Solid line
- q = 1904.1 — color: black; symbol: Solid line
Annotations
- DYN. PRESS: q = 76.2 lb/ft (text_label - position: Label for the first dynamic pressure curve)
| Pressure Altitude (1000 ft) | q = 76.2 | q = 135.4 | q = 211.5 | q = 304.6 | q = 414.6 | q = 541.6 | q = 685.5 | q = 846.3 | q = 1024.03 | q = 1218.6 | q = 1430.2 | q = 1658.2 | q = 1904.1 |
|---|---|---|---|---|---|---|---|---|---|---|---|---|---|
| 0 | 0.23 | 0.31 | 0.38 | 0.46 | 0.54 | 0.61 | 0.69 | 0.77 | 0.85 | 0.92 | 1.00 | 1.08 | 1.16 |
| 5 | 0.25 | 0.33 | 0.41 | 0.50 | 0.58 | 0.66 | 0.75 | 0.83 | 0.92 | 1.00 | 1.09 | 1.17 | 1.26 |
| 10 | 0.27 | 0.36 | 0.45 | 0.54 | 0.63 | 0.72 | 0.81 | 0.90 | 1.00 | 1.09 | 1.18 | 1.28 | 1.36 |
| 15 | 0.30 | 0.40 | 0.50 | 0.60 | 0.70 | 0.80 | 0.90 | 1.00 | 1.10 | 1.20 | 1.30 | 1.41 | 1.50 |
| 20 | 0.33 | 0.44 | 0.55 | 0.66 | 0.77 | 0.88 | 0.99 | 1.10 | 1.21 | 1.32 | 1.43 | 1.54 | 1.65 |
| 25 | 0.37 | 0.49 | 0.61 | 0.74 | 0.86 | 0.99 | 1.11 | 1.24 | 1.36 | 1.49 | 1.62 | 1.74 | null |
| 30 | 0.41 | 0.55 | 0.69 | 0.83 | 0.97 | 1.11 | 1.25 | 1.39 | 1.54 | 1.68 | 1.83 | null | null |
| 35 | 0.45 | 0.61 | 0.77 | 0.93 | 1.09 | 1.25 | 1.41 | 1.58 | 1.74 | null | null | null | null |
| 40 | 0.50 | 0.71 | 0.91 | 1.11 | 1.31 | 1.51 | 1.71 | null | null | null | null | null | null |
| 45 | 0.60 | 0.83 | 1.06 | 1.29 | 1.52 | 1.75 | null | null | null | null | null | null | null |
| 50 | 0.71 | 1.01 | 1.31 | 1.61 | null | null | null | null | null | null | null | null | null |
| 55 | 0.84 | 1.20 | 1.56 | null | null | null | null | null | null | null | null | null | null |
| 60 | 1.00 | 1.44 | null | null | null | null | null | null | null | null | null | null | null |
Notes: The chart relates Mach number (y-axis to Pressure Altitude in 1000s of feet (x-axis for various constant values of dynamic pressure 'q'. Units for 'q' are listed as lb/ft, although lb/ft² is the standard unit.))
Figure 514.8D-8. Dynamic pressure as a function of Mach number and altitude.