507.6-2 ADSORPTION
The adherence of water vapor molecules to a surface whose temperature is higher than the dew point. The quantity of moisture that can adhere to the surface depends on the type of material, its surface condition, and the vapor pressure. An estimation of the effects due solely to adsorption is not an easy matter because the effects of absorption, that occurs at the same time, are generally more pronounced.
2.1 Selecting the Humidity Method
After examining requirements documents and applying the tailoring process in Part One of this Standard to determine if warm temperature/humidity conditions are anticipated in the life cycle of materiel, use the following to confirm the need for this Method and to place it in sequence with other methods.
NOTE: Consider the potential synergistic effects of temperature, humidity, and altitude, and the use of Method 520.5 in addition to this Method. However, Method 520 is NOT a substitute for Method 507.
MIL-STD-810H
METHOD 507.6
2.1.1 Effects of Warm, Humid Environments
Temperature-humidity conditions have physical and chemical effects on materiel; the temperature and humidity variations can also trigger synergistic effects or condensation inside materiel. Consider the following typical problems to help determine if this Method is appropriate for the materiel being tested. This list is not intended to be all-inclusive.
- a. Surface effects, such as:
- (1) Oxidation and/or galvanic corrosion of metals.
- (2) Increased chemical reactions.
- (3) Chemical or electrochemical breakdown of organic and inorganic surface coatings.
- (4) Interaction of surface moisture with deposits from external sources to produce a corrosive film.
- (5) Changes in friction coefficients, resulting in binding or sticking.
- b. Changes in material properties, such as:
- (1) Swelling of materials due to sorption effects.
- (2) Other changes in properties.
- (a) Loss of physical strength.
- (b) Electrical and thermal insulating characteristics.
- (c) De-lamination of composite materials.
- (d) Change in elasticity or plasticity.
- (e) Degradation of hygroscopic materials.
- (f) Degradation of explosives and propellants by absorption.
- (g) Degradation of optical element image transmission quality.
- (h) Degradation of lubricants.
- c. Condensation and free water, such as:
- (1) Electrical short circuits.
- (2) Fogging of optical surfaces.
- (3) Changes in thermal transfer characteristics.
2.1.2 Sequence Among Other Methods
- a. General. Use the anticipated life cycle sequence of events as a general sequence guide (see Part One, paragraph 5.5).
- b. Unique to this Method. Humidity testing may produce irreversible effects. If these effects could unrealistically influence the results of subsequent tests on the same item(s), perform humidity testing following those tests. Also, because of the potentially unrepresentative combination of environmental effects, it is generally inappropriate to conduct this test on the same test sample that has previously been subjected to salt fog, sand and dust, or fungus tests. Dynamic environments (vibration and shock) could influence the results of humidity testing. Consider performing these dynamic tests prior to humidity tests.
2.2 Selecting Procedures
This Method consists of two procedures, Procedure I (Induced (Storage and Transit) and Natural Cycles), and Procedure II (Aggravated). Determine the procedure(s) to be used.
NOTE: The materiel’s anticipated Life Cycle Environmental Profile (LCEP) may reveal other scenarios that are not specifically addressed in the procedures. Tailor the procedures as necessary to capture the LCEP variations, but do not reduce the basic test requirements reflected in the below procedures. (See paragraph 2.3 below.)
MIL-STD-810H
METHOD 507.6
2.2.1 Procedure Selection Considerations
- a. The operational purpose of the materiel.
- b. The natural exposure circumstances.
- c. Test data required to determine if the operational purpose of the materiel has been met.
- d. Test duration.
2.2.2 Difference Between Procedures. (See paragraph 1.3c for related information on limitations.)
- a. Procedure I – Induced (Storage and Transit) and Natural Cycles. Once a cycle is selected, perform the storage and transit portion first, followed by the corresponding natural environment portion of the cycle. Procedure I includes:
- (1) three unique cycles that represent conditions that may occur during storage or transit, as well as
- (2) three unique natural environment cycles that are performed on test items that are open to the environment.
NOTE: Although combined under one major column in Table 507.6-I, storage configurations (and any packaging) may differ from configurations for the transit mode (see paragraph 2.3.3). Ensure the configuration used for testing is appropriate for the intended portion of the LCEP. Items in storage or transit could also experience relatively constant conditions if situated near heat-producing equipment, or are sufficiently insulated from external cycling conditions. For the purpose of this test, a “sealed” item is one that could have a relatively high internal level of humidity and lacks continuous or frequent ventilation. It does not include hermetically sealed items.
The internal humidity may be caused by these or other mechanisms:
- (a) Entrapped, highly humid air.
- (b) Presence of free water.
- (c) Penetration of moisture through test item seals (breathing).
- (d) Release of water or water vapor from hygroscopic material within the test item.
- b. Procedure II – Aggravated. Procedure II exposes the test item to more extreme temperature and humidity levels than those found in nature (without contributing degrading elements), but for shorter durations. Its advantage is that it produces results quickly, i.e., it may, generally, exhibit temperature-humidity effects sooner than in the natural or induced procedures. Its disadvantage is that the effects may not accurately represent those that will be encountered in actual service. Be careful when interpreting results. This procedure is used to identify potential problem areas, and the test levels are fixed.
2.3 Determine Test Levels, Conditions, and Durations
Related test conditions depend on the climate, duration, and test item configuration during shipping, storage, and deployment. The variables common to both procedures are the temperature-humidity cycles, duration, and configuration. These variables are discussed below. Requirements documents may impose or imply additional test conditions. Otherwise, use the worst-case conditions to form the basis for selecting the test and test conditions to use.
2.3.1 Test Temperature - Humidity
The specific test temperature - humidity values are selected, preferably, from the requirements documents. If this information is not available, base determination of the test temperature-humidity values for Procedure I on the world geographical areas in which the test item will be used, plus any additional considerations. Table 507.6-I was developed from AR 70-38 (paragraph 6.1, reference a), MIL-HDBK-310 (paragraph 6.1, reference b), NATO STANAG 4370 (paragraph 6.1, reference d), AECTP 200 (paragraph 6.1, reference e), and NATO STANAG 4370, AECTP 230 (paragraph 6.1, reference c, (part three)) and includes the temperature and relative humidity conditions for three geographical categories where high relative humidity conditions may be of concern, and three related categories of induced conditions. The temperature and humidity data are those used in the source documents
mentioned above. The cycles were derived from available data; other geographic areas could be more severe. For Procedure I, the temperature and humidity levels in Table 507.6-I are representative of specific climatic areas; the natural cycles are not adjustable. Figures 507.6-1 through 507.6-6 are visual representations of the cycles in Table 507.6-I.
Although they occur briefly or seasonally in the mid-latitudes, basic high humidity conditions are found most often in tropical areas. One of the two high humidity cycles (constant high humidity) represents conditions in the heavily forested areas where nearly constant conditions may prevail during rainy and wet seasons. Exposed materiel is likely to be constantly wet or damp for many days at a time. A description of each category follows.
- a. Constant high humidity (Cycle B1). Constant high humidity is found most often in tropical areas, although it occurs briefly or seasonally in the mid-latitudes. The constant-high-humidity cycle represents conditions in heavily forested areas where nearly constant temperature and humidity may prevail during rainy and wet seasons with little (if any) solar radiation exposure. Tropical exposure in a tactical configuration or mode is likely to occur under a jungle canopy. Exposed materiel is likely to be constantly wet or damp for many days at a time. World areas where these conditions occur are the Congo and Amazon Basins, the jungles of Central America, Southeast Asia (including the East Indies), the north and east coasts of Australia, the east coast of Madagascar, and the Caribbean Islands. The conditions can exist for 25 to 30 days each month in the most humid areas of the tropics. The most significant variation of this cycle is its frequency of occurrence. In many equatorial areas, it occurs monthly, year round, although many equatorial areas experience a distinctive dry season. The frequency decreases as the distance from the equator increases. The mid-latitudes can experience these conditions several days a month for two to three months a year. See Part Three for further information on the description of the environments.
- b. Cyclic high humidity (Cycle B2). Cyclic high humidity conditions are found in the open in tropical areas where solar radiation is a factor. If the item in its operational configuration is subject to direct solar radiation exposure, it is permissible to conduct the natural cycle with simulated solar radiation. See Part Three, Table VII, for the associated B2 diurnal solar radiation parameters. In these areas, exposed items are subject to alternate wetting and drying, but the frequency and duration of occurrence are essentially the same as in the constant high humidity areas. Cycle B2 conditions occur in the same geographical areas as the Cycle B1 conditions, but the B1 conditions typically are encountered under a jungle canopy, so the B1 description above also applies to the B2 area.
- c. Hot-humid (Cycle B3). Severe (high) dewpoint conditions occur 10 to 15 times a year along a very narrow coastal strip, probably less than 5 miles wide, bordering bodies of water with high surface temperatures, specifically the Persian Gulf and the Red Sea. If the item in its operational configuration is subject to direct solar radiation exposure, it is permissible to conduct the natural cycle with simulated solar radiation. See Part Three, Table V for the associated B3 diurnal solar radiation parameters. Most of the year, these same areas experience hot dry (A1) conditions. This cycle is unique to materiel to be deployed specifically in the Persian Gulf or Red Sea regions, and is not to be used as a substitute for worldwide exposure requirements where B1 or B2 would apply.
In addition to these three categories of natural high-humidity conditions, there are three cycles for induced (storage and transit) conditions:
- d. Induced constant high humidity (Cycle B1). Relative humidity above 95 percent in association with nearly constant 27 °C (80 °F) temperature occurs for periods of a day or more.
- e. Induced variable - high humidity (Cycle B2). This condition exists when materiel in the variable-high-humidity category receives heat from solar radiation with little or no cooling air. See storage and transit conditions associated with the hot-humid daily cycle of the hot climatic design type below in Table 507.6-I.
- f. Induced hot-humid (Cycle B3). This condition exists when materiel in the hot-humid category receives heat from solar radiation with little or no cooling air. The daily cycle for storage and transit in Table 507.6-I shows 5 continuous hours with air temperatures at or above 66 °C (150 °F), and an extreme air temperature of 71 °C (160 °F) for not more than 1 hour.
| Natural¹ | Induced (Storage and Transit) | |||||||||||||||||
|---|---|---|---|---|---|---|---|---|---|---|---|---|---|---|---|---|---|---|
| High Humidity | Hot Humid (Cycle B3) | Constant Temp. (Cycle B1) | Cyclic High RH (Cycle B2) | Hot Humid (Cycle B3) | ||||||||||||||
| Constant Temp. (Cycle B1) | Cyclic High RH (Cycle B2) | |||||||||||||||||
| Temp | RH | Temp | RH | Temp | RH | Temp | RH | Temp | RH | Temp | RH | |||||||
| Time | °C | °F | % | °C | °F | % | °C | °F | % | °C | °F | % | °C | °F | % | °C | °F | % |
| 0100 | Nearly constant at 24°C (75°F) throughout the 24 hours | 27 | 80 | 1002 | 31 | 88 | 88 | Nearly constant at 27°C (80°F) throughout the 24 hours | 33 | 91 | 69 | 35 | 95 | 67 | ||||
| 0200 | 26 | 79 | 100 | 31 | 88 | 88 | 32 | 90 | 70 | 34 | 94 | 72 | ||||||
| 0300 | 26 | 79 | 100 | 31 | 88 | 88 | 32 | 90 | 71 | 34 | 94 | 75 | ||||||
| 0400 | 26 | 79 | 100 | 31 | 88 | 88 | 31 | 88 | 72 | 34 | 93 | 77 | ||||||
| 0500 | 26 | 78 | 100 | 31 | 88 | 88 | 30 | 86 | 74 | 33 | 92 | 79 | ||||||
| 0600 | 29 | 78 | 100 | 32 | 90 | 85 | 31 | 88 | 75 | 33 | 91 | 80 | ||||||
| 0700 | 27 | 81 | 94 | 34 | 93 | 80 | 34 | 93 | 64 | 36 | 97 | 70 | ||||||
| 0800 | 29 | 84 | 88 | 36 | 96 | 76 | 38 | 101 | 54 | 40 | 104 | 54 | ||||||
| 0900 | 31 | 87 | 82 | 37 | 98 | 73 | 42 | 107 | 43 | 44 | 111 | 42 | ||||||
| 1000 | 32 | 89 | 79 | 38 | 100 | 69 | 45 | 113 | 36 | 51 | 124 | 31 | ||||||
| 1100 | 33 | 92 | 77 | 39 | 102 | 65 | 51 | 124 | 29 | 57 | 135 | 24 | ||||||
| 1200 | 34 | 94 | 75 | 40 | 104 | 62 | 57 | 134 | 22 | 62 | 144 | 17 | ||||||
| 1300 | 34 | 94 | 74 | 41 | 105 | 59 | 61 | 142 | 21 | 66 | 151 | 16 | ||||||
| 1400 | 35 | 95 | 74 | 41 | 105 | 59 | 63 | 145 | 20 | 69 | 156 | 15 | ||||||
| 1500 | 35 | 95 | 74 | 41 | 105 | 59 | 63 | 145 | 19 | 71 | 160 | 14 | ||||||
| 1600 | 34 | 93 | 76 | 41 | 105 | 59 | 62 | 144 | 20 | 69 | 156 | 16 | ||||||
| 1700 | 33 | 92 | 79 | 39 | 102 | 65 | 60 | 140 | 21 | 66 | 151 | 18 | ||||||
| 1800 | 32 | 90 | 82 | 37 | 99 | 69 | 57 | 134 | 22 | 63 | 145 | 21 | ||||||
| 1900 | 31 | 88 | 86 | 36 | 97 | 73 | 50 | 122 | 32 | 58 | 136 | 29 | ||||||
| 2000 | 29 | 85 | 91 | 34 | 94 | 79 | 44 | 111 | 43 | 50 | 122 | 41 | ||||||
| 2100 | 28 | 83 | 95 | 33 | 91 | 85 | 38 | 101 | 54 | 41 | 105 | 53 | ||||||
| 2200 | 28 | 82 | 96 | 32 | 90 | 85 | 35 | 95 | 59 | 39 | 103 | 58 | ||||||
| 2300 | 27 | 81 | 100 | 32 | 89 | 88 | 34 | 93 | 63 | 37 | 99 | 62 | ||||||
| 2400 | 27 | 80 | 100 | 31 | 88 | 88 | 33 | 91 | 68 | 35 | 95 | 63 | ||||||
2.3.2 Test Duration
The number of temperature - humidity cycles (total test time) is critical in achieving the purpose of the test. The durations provided in Table 507.6-II are minimum durations and, in most cases, are far less than necessary to provide an annual comparison. Apply the number of test cycles on a one-for-one basis, i.e., 45 cycles equates to 45 days in the natural environment, and is not related to any acceleration factor. For Procedure I, see Table 507.6-II and use the storage and transit durations for the appropriate cycle (B1, B2, or B3), followed by the corresponding natural cycle duration. For Procedure II guidance, see paragraph 2.3.2c below.
NOTE: The climate station selected for these categories was Majuro, Marshall Islands (7°05' N, 171°23'E). The station is located at the Majuro Airport Weather Services building. This site is a first-order U.S. weather reporting station. Majuro was selected over 12 available candidate stations from around the world initially because it possessed the required temperature and precipitation characteristics for the B1 category (resulting in high temperature – humidity conditions), and it met the criteria for data availability and quality.
On the average, Majuro receives over 3,300 mm (130 inches) of rainfall annually. Over 250 days experience rainfall >= 0.01 inch, and over 310 days experience rainfall >= trace. Ten years of continuous data were used for the analysis (POR: 1973-1982).
Groupings of consecutive days of rainfall (and resulting humidity) were then extracted. The longest continuous streak of consecutive days >= trace was 51. A cumulative frequency curve was then created. The recommended duration value of 45 days represents the 99th percentile value (actual value = 98.64%).
NOTE: During or after this test, document any degradation that could contribute to failure of the test item during more extensive exposure periods (i.e., indications of potential long term problems), or during exposure to other deployment environments such as shock and vibration. Further, extend testing for a sufficient period of time to evaluate the long-term effect of its realistic deployment duration (deterioration rate becomes asymptotic).
- a. Procedure Ia - Induced (Storage and Transit) Cycles
- (1) Hazardous test items. Hazardous test items will generally require longer tests than nonhazardous items to establish confidence in test results. Since induced conditions are much more severe than natural conditions, potential problems associated with high temperature/high relative humidity will be revealed sooner, and the results can be analyzed with a higher degree of confidence. Consequently, expose hazardous test items to extended periods (double the normal periods) of conditioning, depending upon the geographical category to which the materiel will be exposed (see Table 507.6-II, induced cycles B1 through B3).
- (2) Non-hazardous test items. Induced conditions are much more severe than natural conditions, and potential problems associated with high temperature/high humidity will thus be revealed sooner, and the results can be analyzed, in most cases, with a higher degree of confidence. Expose non-hazardous test items to test durations as specified in Table 507.6-II, induced cycles B1 through B3, depending upon the geographical category to which the material will be exposed.
- b. Procedure Ib - Natural Cycles
- (1) Hazardous test items. Hazardous test items are those in which any unknown physical deterioration sustained during testing could ultimately result in damage to materiel or injury or death to personnel when the test item is used. Hazardous test items will generally require longer test durations than nonhazardous test items to establish confidence in the test results. Twice the normal test duration is recommended (see Table 507.6-II, cycles B1 through B3).
- (2) Nonhazardous test items. Nonhazardous test items should be exposed from 15 to 45 cycles of conditioning, depending upon the geographical area to which the materiel will be exposed (see Table 507.6-II, cycles B1 through B3).
| MATERIEL CATEGORY | NATURAL¹ | INDUCED (STORAGE and TRANSIT) | ||||
|---|---|---|---|---|---|---|
| Cycle B1 | Cycle B2 | Cycle B3 | Cycle B1 | Cycle B2 | Cycle B3 | |
| Hazardous Items Normal Test Duration | 90 | 90 | 30 | 180 | 180 | 30 |
| Non-Hazardous Items Normal Test Duration | 45 | 45 | 15 | 90 | 90 | 15 |
¹ Perform operational checks at least once every five days; more frequent checks may provide early detection of potential problems.
- c. Procedure II – Aggravated Cycle. For Procedure II, in addition to a 24-hour conditioning cycle (paragraph 4.4.2.2), the minimum number of 24-hour cycles for the test is ten. Although the combined 60 °C (140 °F) and 95 percent RH does not occur in nature, this combination of temperature and relative humidity, has historically proven adequate to reveal potential effects in most materiel. Extend the test as specified in the test plan to provide a higher degree of confidence in the materiel to withstand warm, humid conditions. For the test items incorporating seals to protect moisture-sensitive materials, e.g., pyrotechnics, longer test durations may be required.
2.3.3
Test Item Configuration. During conduct of the temperature-humidity procedures of this Method, configure the test item as specified below, or as specifically outlined in the requirements documents. Test item configuration must be selected to reproduce, as closely as technically possible, the configuration that the test item would assume when worst-case situations are encountered during its life cycle.
- a. In its assigned shipping/storage container, or as installed in the end item.
- b. Out of its shipping/storage container but not set up in its deployment mode.
- c. In its operational mode (realistically or with restraints, such as with openings that are normally covered).
2.3.4 Additional Guidelines. Review the requirements documents. Apply any additional guidelines necessary
2.4 Operational Checkout
2.4.1 Procedure I (Induced Cycles B1, B2, or B3, Followed By Natural Cycles B1, B2, or B3)
- a. Procedure Ia: Induced (storage and transit) cycles B1, B2, and B3 represent storage and transit environments. As such, perform operational checkouts before and after each test.
- b. Procedure Ib: Natural cycles B1 - B3 represent the operational environment, and, theoretically, the materiel could be functioning non-stop in the natural environment. In this case, operate the test item continuously throughout the test procedure. If shorter operational periods are identified in the requirements document(s), operate the test item at least once every five cycles for a duration necessary to verify proper operation. This operational checkout will help determine effects of the natural cycles on test item(s) as soon as possible.
2.4.2 Procedure II - Aggravated
Procedure II does not represent naturally-occurring conditions; therefore it may produce an acceleration of potential temperature-humidity effects. If the test item is intended to be operated in a warm, humid environment, perform at least one operational checkout every five cycles during the periods shown on Figure 507.6-7.
2.5 Test Variations
The most important ways the tests can vary are in the number of temperature-humidity cycles, relative humidity, and temperature levels and durations, test item performance monitoring (where appropriate), and test item ventilation.
2.6 Philosophy of Testing
Procedures Ia and Ib are intended to reveal representative effects that typically occur when materiel is exposed to elevated temperature-humidity conditions in storage and transit, followed by actual service where moderate to high instances of such an environment exist. (See paragraph 2.1.1 above for categories and examples of these effects.)
MIL-STD-810H
METHOD 507.6
Test item failures do not necessarily indicate failures in the natural environment. Test results must be evaluated accordingly. The most productive sequence of testing is to expose the test item to the storage and transit environment, then follow it by exposure to the naturally occurring cycles anticipated for the operational environment.
2.6.1 Procedure I - Induced (Storage and Transit) Cycles
Three induced cycles in Table 507.6-I and Figures 507.6-1 though 507.6-3 present what is referred to as “Storage and Transit Conditions.” The most extreme of the three cycles (cycle B3) has five continuous hours with air temperatures at or above 66 °C (150 °F), and an extreme air temperature of 71 °C (160 °F) for not more than 1 hour. Testing for these conditions should be done, if practical, according to the daily cycle.
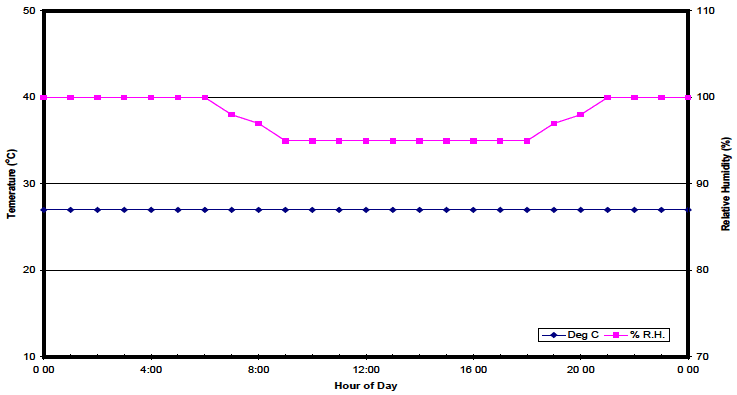
Figure description:
24-Hour Environmental Monitoring Chart
Temperature and Relative Humidity Profile
Legend
- Deg C — color: Dark blue; symbol: Diamond markers with solid line
- % R.H. — color: Magenta; symbol: Square markers with solid line
| Hour of Day | Temperature (°C) | Relative Humidity (%) |
|---|---|---|
| 0:00 | 27 | 100 |
| 1:00 | 27 | 100 |
| 2:00 | 27 | 100 |
| 3:00 | 27 | 100 |
| 4:00 | 27 | 100 |
| 5:00 | 27 | 100 |
| 6:00 | 27 | 100 |
| 7:00 | 27 | 98.3 |
| 8:00 | 27 | 96.7 |
| 9:00 | 27 | 95 |
| 10:00 | 27 | 95 |
| 11:00 | 27 | 95 |
| 12:00 | 27 | 95 |
| 13:00 | 27 | 95 |
| 14:00 | 27 | 95 |
| 15:00 | 27 | 95 |
| 16:00 | 27 | 95 |
| 17:00 | 27 | 95 |
| 18:00 | 27 | 95 |
| 19:00 | 27 | 96.7 |
| 20:00 | 27 | 98.3 |
| 21:00 | 27 | 100 |
| 22:00 | 27 | 100 |
| 23:00 | 27 | 100 |
| 24:00 | 27 | 100 |
Notes: The chart shows a constant temperature maintained at approximately 27°C throughout a 24-hour cycle. The relative humidity starts at 100%, ramps down to 95% between 6:00 and 9:00, remains constant until 18:00, and then ramps back up to 100% by 21:00. Note the misspelling of 'Temerature' on the left vertical axis in the original image.
Figure 507.6-1. Induced Cycle B1 - Storage and transit.
| Time | Temp. | RH | Time | Temp. | RH | ||
|---|---|---|---|---|---|---|---|
| °C | °F | Percent | °C | °F | Percent | ||
| 0100 | Nearly constant at 27°C (80°F) throughout the 24 hours. | 100 | 1300 | Nearly constant at 27°C (80°F) throughout the 24 hours. | 95 | ||
| 0200 | 100 | 1400 | 95 | ||||
| 0300 | 100 | 1500 | 95 | ||||
| 0400 | 100 | 1600 | 95 | ||||
| 0500 | 100 | 1700 | 95 | ||||
| 0600 | 100 | 1800 | 95 | ||||
| 0700 | 98 | 1900 | 97 | ||||
| 0800 | 97 | 2000 | 98 | ||||
| 0900 | 95 | 2100 | 100 | ||||
| 1000 | 95 | 2200 | 100 | ||||
| 1100 | 95 | 2300 | 100 | ||||
| 1200 | 95 | 2400 | 100 | ||||
MIL-STD-810H METHOD 507.6
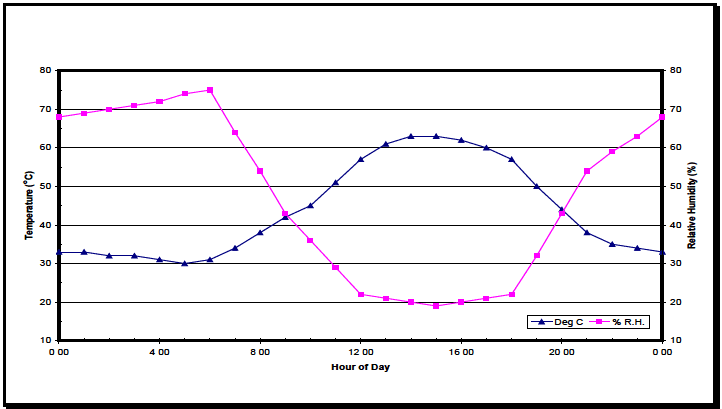
Figure description:
Legend
- Deg C — color: blue; symbol: Blue line with upward-pointing triangles
- % R.H. — color: pink; symbol: Pink line with squares
| Hour of Day | Temperature (°C) | Relative Humidity (%) |
|---|---|---|
| 0:00 | 33 | 68 |
| 1:00 | 33 | 69 |
| 2:00 | 32 | 70 |
| 3:00 | 32 | 71 |
| 4:00 | 31 | 72 |
| 5:00 | 30 | 74 |
| 6:00 | 31 | 75 |
| 7:00 | 34 | 64 |
| 8:00 | 38 | 54 |
| 9:00 | 42 | 43 |
| 10:00 | 45 | 36 |
| 11:00 | 51 | 29 |
| 12:00 | 57 | 22 |
| 13:00 | 61 | 21 |
| 14:00 | 63 | 20 |
| 15:00 | 63 | 19 |
| 16:00 | 62 | 20 |
| 17:00 | 60 | 21 |
| 18:00 | 57 | 22 |
| 19:00 | 50 | 32 |
| 20:00 | 44 | 43 |
| 21:00 | 38 | 54 |
| 22:00 | 35 | 59 |
| 23:00 | 34 | 63 |
| 24:00 | 33 | 68 |
Notes: The chart displays the variation of Temperature in degrees Celsius and Relative Humidity as a percentage over a 24-hour period. Temperature values are plotted against the left y-axis, and Relative Humidity values are plotted against the right y-axis. Data points are provided hourly.
Figure 507.6-2. Induced Cycle B2 - Storage and transit.
| Time | Temp. | RH Percent | Time | Temp. | RH Percent | ||
|---|---|---|---|---|---|---|---|
| °C | °F | °C | °F | ||||
| 0100 | 33 | 91 | 69 | 1300 | 61 | 142 | 21 |
| 0200 | 32 | 90 | 70 | 1400 | 63 | 145 | 20 |
| 0300 | 32 | 90 | 71 | 1500 | 63 | 145 | 19 |
| 0400 | 31 | 88 | 72 | 1600 | 62 | 144 | 20 |
| 0500 | 30 | 86 | 74 | 1700 | 60 | 140 | 21 |
| 0600 | 31 | 88 | 75 | 1800 | 57 | 134 | 22 |
| 0700 | 34 | 93 | 64 | 1900 | 50 | 122 | 32 |
| 0800 | 38 | 101 | 54 | 2000 | 44 | 111 | 43 |
| 0900 | 42 | 107 | 43 | 2100 | 38 | 101 | 54 |
| 1000 | 45 | 113 | 36 | 2200 | 35 | 95 | 59 |
| 1100 | 51 | 124 | 29 | 2300 | 34 | 93 | 63 |
| 1200 | 57 | 134 | 22 | 2400 | 33 | 91 | 68 |
MIL-STD-810H
METHOD 507.6
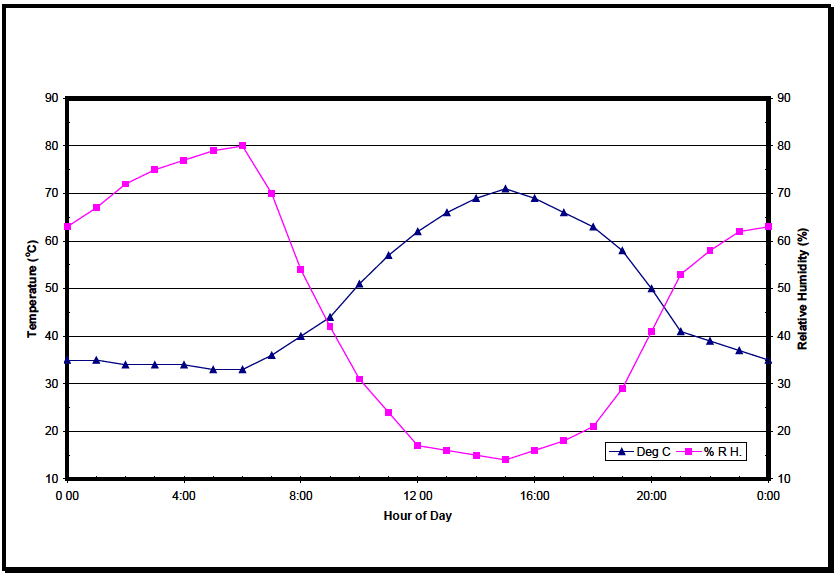
Figure description:
Legend
- Deg C — color: dark blue; symbol: Triangle
- % R H. — color: magenta; symbol: Square
| Hour of Day | Temperature (°C) | Relative Humidity (%) |
|---|---|---|
| 0:00 | 35 | 63 |
| 1:00 | 35 | 67 |
| 2:00 | 34 | 72 |
| 3:00 | 34 | 75 |
| 4:00 | 34 | 77 |
| 5:00 | 33 | 79 |
| 6:00 | 33 | 80 |
| 7:00 | 36 | 70 |
| 8:00 | 40 | 54 |
| 9:00 | 44 | 42 |
| 10:00 | 51 | 31 |
| 11:00 | 57 | 24 |
| 12:00 | 62 | 17 |
| 13:00 | 66 | 16 |
| 14:00 | 69 | 15 |
| 15:00 | 71 | 14 |
| 16:00 | 69 | 16 |
| 17:00 | 66 | 18 |
| 18:00 | 63 | 21 |
| 19:00 | 58 | 29 |
| 20:00 | 50 | 41 |
| 21:00 | 41 | 53 |
| 22:00 | 39 | 58 |
| 23:00 | 37 | 62 |
| 0:00 | 35 | 63 |
Notes: The chart features a dual Y-axis. The left axis represents Temperature in degrees Celsius, and the right axis represents Relative Humidity in percentage. Both axes use the same scale from 10 to 90.
Figure 507.6-3. Induced Cycle B3 - Storage and transit.
| Time | Temp. | RH Percent | Time | Temp. | RH Percent | ||
|---|---|---|---|---|---|---|---|
| °C | °F | °C | °F | ||||
| 0100 | 35 | 95 | 67 | 1300 | 66 | 151 | 16 |
| 0200 | 34 | 94 | 72 | 1400 | 69 | 156 | 15 |
| 0300 | 34 | 94 | 75 | 1500 | 71 | 160 | 14 |
| 0400 | 34 | 93 | 77 | 1600 | 69 | 156 | 16 |
| 0500 | 33 | 92 | 79 | 1700 | 66 | 151 | 18 |
| 0600 | 33 | 91 | 80 | 1800 | 63 | 145 | 21 |
| 0700 | 36 | 97 | 70 | 1900 | 58 | 136 | 29 |
| 0800 | 40 | 104 | 54 | 2000 | 50 | 122 | 41 |
| 0900 | 44 | 111 | 42 | 2100 | 41 | 105 | 53 |
| 1000 | 51 | 124 | 31 | 2200 | 39 | 103 | 58 |
| 1100 | 57 | 135 | 24 | 2300 | 37 | 99 | 62 |
| 1200 | 62 | 144 | 17 | 2400 | 35 | 95 | 63 |
2.6.2 Procedure I - Natural Cycles
Three natural cycles in Table 507.6-I and Figures 507.6-4 through 507.6-6 reflect data in specific climatic regions as identified in AR 70-38 (paragraph 6.1, reference a) and NATO STANAG 4370, AECTP 230 (paragraph 6.1, reference c). The complex temperature/humidity/solar radiation environment with its associated antagonistic elements such as microbial growth, acidic atmosphere, and other biological elements produce synergistic effects that cannot be practically duplicated in the laboratory. Coupled with these test data interpretation problems are the
extensive durations of real-world environments that, in most cases, are too lengthy to realistically apply in the laboratory. Before undertaking such laboratory testing, consider testing in the natural environment. Otherwise, exercise caution in applying such cycles and in interpreting test results.
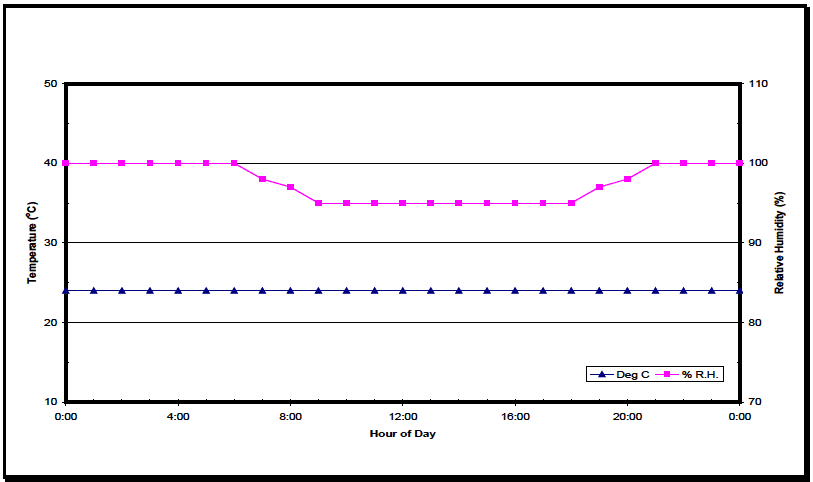
Figure description:
Legend
- Deg C — color: dark blue; symbol: Solid line with triangle markers
- % R.H. — color: magenta; symbol: Solid line with square markers
| Hour of Day | Deg C | % R.H. |
|---|---|---|
| 0:00 | 24 | 100 |
| 1:00 | 24 | 100 |
| 2:00 | 24 | 100 |
| 3:00 | 24 | 100 |
| 4:00 | 24 | 100 |
| 5:00 | 24 | 100 |
| 6:00 | 24 | 100 |
| 7:00 | 24 | 98.3 |
| 8:00 | 24 | 96.7 |
| 9:00 | 24 | 95 |
| 10:00 | 24 | 95 |
| 11:00 | 24 | 95 |
| 12:00 | 24 | 95 |
| 13:00 | 24 | 95 |
| 14:00 | 24 | 95 |
| 15:00 | 24 | 95 |
| 16:00 | 24 | 95 |
| 17:00 | 24 | 95 |
| 18:00 | 24 | 95 |
| 19:00 | 24 | 96.7 |
| 20:00 | 24 | 98.3 |
| 21:00 | 24 | 100 |
| 22:00 | 24 | 100 |
| 23:00 | 24 | 100 |
| 0:00 | 24 | 100 |
Notes: The chart shows a 24-hour environmental profile. Temperature (left y-axis remains constant at approximately 24°C throughout the period. Relative Humidity (right y-axis starts at 100%, begins to decrease linearly at 6:00 until it reaches 95% at 9:00, stays constant at 95% until 18:00, and then increases linearly back to 100% by 21:00, where it remains for the rest of the cycle.))
Figure 507.6-4. Natural Cycle B1 – Constant high humidity.
| Time | Temp. | RH | Time | Temp. | RH | ||
|---|---|---|---|---|---|---|---|
| °C | °F | Percent | °C | °F | Percent | ||
| 0100 | Nearly constant at 24°C (75°F) throughout the 24 hours. | 100 | 1300 | Nearly constant at 24°C (75°F) throughout the 24 hours. | 95 | ||
| 0200 | 100 | 1400 | 95 | ||||
| 0300 | 100 | 1500 | 95 | ||||
| 0400 | 100 | 1600 | 95 | ||||
| 0500 | 100 | 1700 | 95 | ||||
| 0600 | 100 | 1800 | 95 | ||||
| 0700 | 98 | 1900 | 97 | ||||
| 0800 | 97 | 2000 | 98 | ||||
| 0900 | 95 | 2100 | 100 | ||||
| 1000 | 95 | 2200 | 100 | ||||
| 1100 | 95 | 2300 | 100 | ||||
| 1200 | 95 | 2400 | 100 | ||||
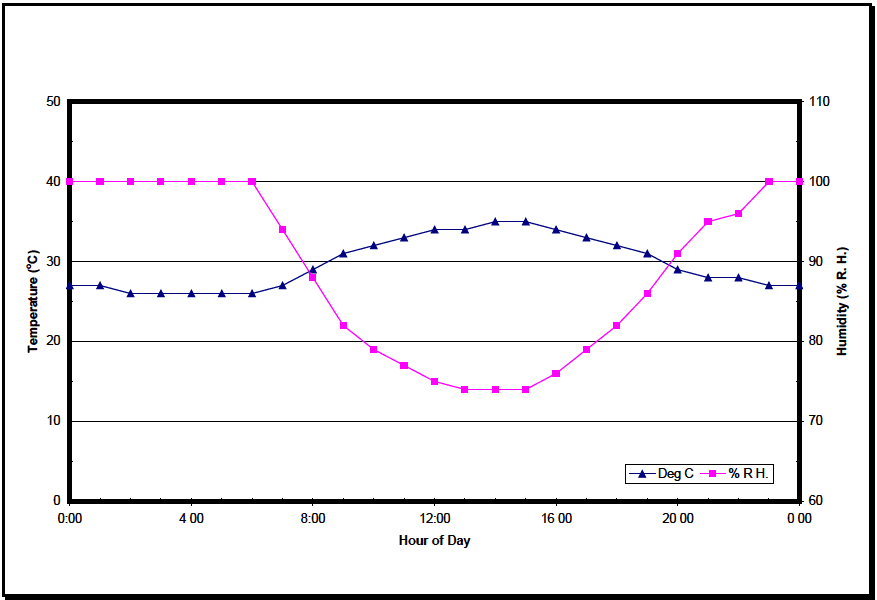
Figure description:
Legend
- Deg C — color: Dark Blue; symbol: Triangle
- % R. H. — color: Magenta; symbol: Square
| Hour of Day | Deg C | % R. H. |
|---|---|---|
| 0:00 | 27 | 100 |
| 1:00 | 27 | 100 |
| 2:00 | 26 | 100 |
| 3:00 | 26 | 100 |
| 4:00 | 26 | 100 |
| 5:00 | 26 | 100 |
| 6:00 | 26 | 100 |
| 7:00 | 27 | 94 |
| 8:00 | 29 | 88 |
| 9:00 | 31 | 82 |
| 10:00 | 32 | 79 |
| 11:00 | 33 | 77 |
| 12:00 | 34 | 75 |
| 13:00 | 34 | 74 |
| 14:00 | 35 | 74 |
| 15:00 | 35 | 74 |
| 16:00 | 34 | 76 |
| 17:00 | 33 | 79 |
| 18:00 | 32 | 82 |
| 19:00 | 31 | 86 |
| 20:00 | 29 | 91 |
| 21:00 | 28 | 95 |
| 22:00 | 28 | 96 |
| 23:00 | 27 | 100 |
| 0:00 | 27 | 100 |
Notes: The graph depicts a 24-hour cycle of temperature and humidity. The left Y-axis measures temperature in degrees Celsius (0 to 50, and the right Y-axis measures relative humidity in percentage (60 to 110. Data points are provided at hourly intervals. The x-axis labels are inconsistently formatted in the original image (some with colons, some with spaces.)))
Figure 507.6-5. Natural Cycle B2 – Cyclic high humidity.
| Time | Temp. | RH | Time | Temp. | RH | ||
|---|---|---|---|---|---|---|---|
| °C | °F | Percent | °C | °F | Percent | ||
| 0100 | 27 | 80 | 100 | 1300 | 34 | 94 | 74 |
| 0200 | 26 | 79 | 100 | 1400 | 35 | 95 | 74 |
| 0300 | 26 | 79 | 100 | 1500 | 35 | 95 | 74 |
| 0400 | 26 | 79 | 100 | 1600 | 34 | 94 | 76 |
| 0500 | 26 | 78 | 100 | 1700 | 33 | 92 | 79 |
| 0600 | 26 | 78 | 100 | 1800 | 32 | 90 | 82 |
| 0700 | 27 | 81 | 94 | 1900 | 31 | 88 | 86 |
| 0800 | 29 | 84 | 88 | 2000 | 29 | 85 | 91 |
| 0900 | 31 | 87 | 82 | 2100 | 28 | 83 | 95 |
| 1000 | 32 | 89 | 79 | 2200 | 28 | 82 | 96 |
| 1100 | 33 | 92 | 77 | 2300 | 27 | 81 | 100 |
| 1200 | 34 | 94 | 75 | 2400 | 27 | 80 | 100 |
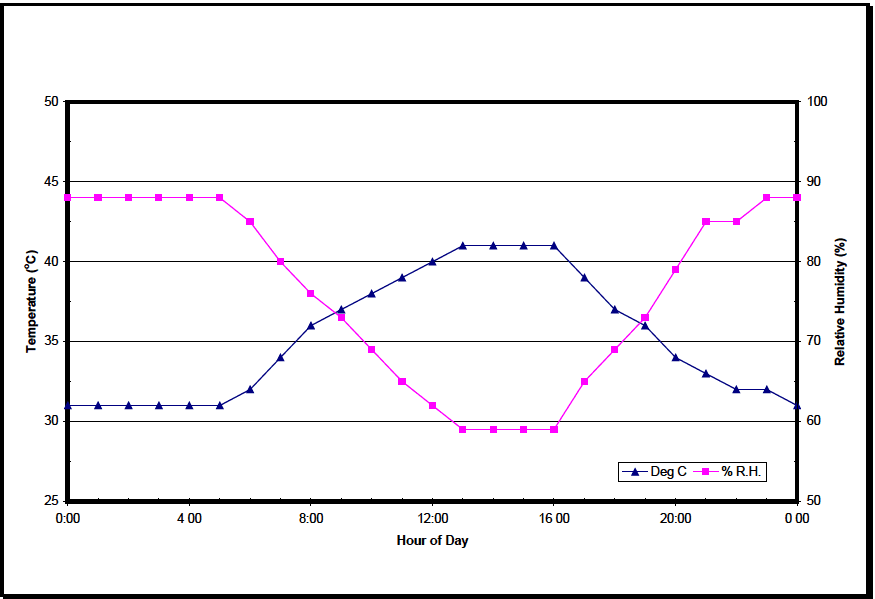
Figure description:
Temperature vs Relative Humidity
Temperature and Relative Humidity over Time
Legend
- Deg C — color: blue; symbol: triangle
- % R.H. — color: magenta; symbol: square
| Hour of Day | Temperature (°C) | Relative Humidity (%) |
|---|---|---|
| 0:00 | 31 | 88 |
| 1:00 | 31 | 88 |
| 2:00 | 31 | 88 |
| 3:00 | 31 | 88 |
| 4:00 | 31 | 88 |
| 5:00 | 31 | 88 |
| 6:00 | 32 | 85 |
| 7:00 | 34 | 80 |
| 8:00 | 36 | 76 |
| 9:00 | 37 | 73 |
| 10:00 | 38 | 69 |
| 11:00 | 39 | 65 |
| 12:00 | 40 | 62 |
| 13:00 | 41 | 59 |
| 14:00 | 41 | 59 |
| 15:00 | 41 | 59 |
| 16:00 | 41 | 59 |
| 17:00 | 39 | 65 |
| 18:00 | 37 | 69 |
| 19:00 | 36 | 73 |
| 20:00 | 34 | 79 |
| 21:00 | 33 | 85 |
| 22:00 | 32 | 85 |
| 23:00 | 32 | 88 |
| 0:00 | 31 | 88 |
Notes: The chart illustrates a 24-hour cycle of temperature (in Celsius and relative humidity (in percentage. The data points appear to be recorded at one-hour intervals.))
Figure 507.6-6. Natural Cycle B3 - Hot humid.
| Time | Temp. | RH Percent | Time | Temp. | RH Percent | ||
|---|---|---|---|---|---|---|---|
| °C | °F | °C | °F | ||||
| 0100 | 31 | 88 | 88 | 1300 | 41 | 105 | 59 |
| 0200 | 31 | 88 | 88 | 1400 | 41 | 105 | 59 |
| 0300 | 31 | 88 | 88 | 1500 | 41 | 105 | 59 |
| 0400 | 31 | 88 | 88 | 1600 | 41 | 105 | 59 |
| 0500 | 31 | 88 | 88 | 1700 | 39 | 102 | 65 |
| 0600 | 32 | 90 | 85 | 1800 | 37 | 99 | 69 |
| 0700 | 34 | 93 | 80 | 1900 | 36 | 97 | 73 |
| 0800 | 36 | 96 | 76 | 2000 | 34 | 94 | 79 |
| 0900 | 37 | 98 | 73 | 2100 | 33 | 91 | 85 |
| 1000 | 38 | 100 | 69 | 2200 | 32 | 90 | 85 |
| 1100 | 39 | 102 | 65 | 2300 | 32 | 89 | 88 |
| 1200 | 40 | 104 | 62 | 2400 | 31 | 88 | 88 |
2.6.3 Procedure II - Aggravated Cycle (Figure 507.6-7)
The purpose of the aggravated test procedure is to produce representative effects that typically occur when materiel is exposed to elevated temperature-humidity conditions. (See paragraph 2.1.1 above for categories and examples of
these effects.) Accordingly, this procedure does not reproduce naturally occurring or service-induced temperature-humidity scenarios. It may induce problems that are indicative of long-term effects. Test item failures do not necessarily indicate failures in the real environment.
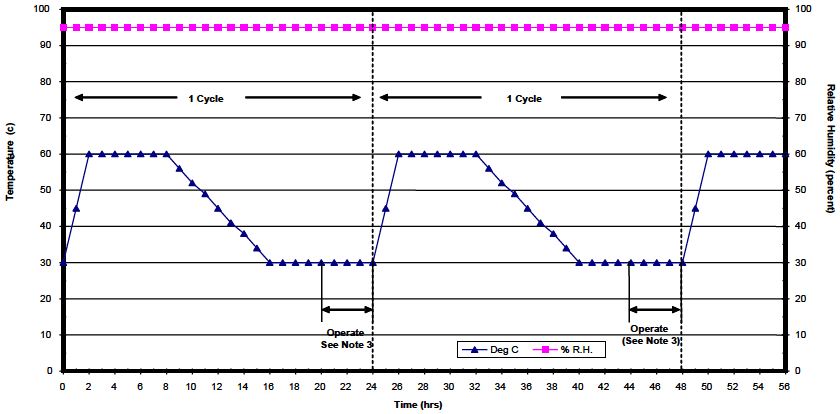
Figure description:
Temperature and Relative Humidity vs Time
Legend
- Deg C — color: blue; symbol: Solid line with triangle markers
- % R.H. — color: pink; symbol: Solid line with square markers
Annotations
- 1 Cycle (horizontal_range - position: Time = 0 to 24 hrs)
- 1 Cycle (horizontal_range - position: Time = 24 to 48 hrs)
- Cycle Boundary (vertical_line - position: x = 24)
- Cycle Boundary (vertical_line - position: x = 48)
- Operate See Note 3 (horizontal_range - position: Time = ~20.3 to 24 hrs)
- Operate See Note 3 (horizontal_range - position: Time = ~44.3 to 48 hrs)
| Time (hrs) | Deg C | % R.H. |
|---|---|---|
| 0 | 30 | 95 |
| 1 | 45 | 95 |
| 2 | 60 | 95 |
| 3 | 60 | 95 |
| 4 | 60 | 95 |
| 5 | 60 | 95 |
| 6 | 60 | 95 |
| 7 | 60 | 95 |
| 8 | 60 | 95 |
| 9 | 56 | 95 |
| 10 | 52 | 95 |
| 11 | 49 | 95 |
| 12 | 45 | 95 |
| 13 | 41 | 95 |
| 14 | 38 | 95 |
| 15 | 34 | 95 |
| 16 | 30 | 95 |
| 17 | 30 | 95 |
| 18 | 30 | 95 |
| 19 | 30 | 95 |
| 20 | 30 | 95 |
| 21 | 30 | 95 |
| 22 | 30 | 95 |
| 23 | 30 | 95 |
| 24 | 30 | 95 |
| 25 | 45 | 95 |
| 26 | 60 | 95 |
| 27 | 60 | 95 |
| 28 | 60 | 95 |
| 29 | 60 | 95 |
| 30 | 60 | 95 |
| 31 | 60 | 95 |
| 32 | 60 | 95 |
| 33 | 56 | 95 |
| 34 | 52 | 95 |
| 35 | 49 | 95 |
| 36 | 45 | 95 |
| 37 | 41 | 95 |
| 38 | 38 | 95 |
| 39 | 34 | 95 |
| 40 | 30 | 95 |
| 41 | 30 | 95 |
| 42 | 30 | 95 |
| 43 | 30 | 95 |
| 44 | 30 | 95 |
| 45 | 30 | 95 |
| 46 | 30 | 95 |
| 47 | 30 | 95 |
| 48 | 30 | 95 |
| 49 | 45 | 95 |
| 50 | 60 | 95 |
| 51 | 60 | 95 |
| 52 | 60 | 95 |
| 53 | 60 | 95 |
| 54 | 60 | 95 |
| 55 | 60 | 95 |
| 56 | 60 | 95 |
Notes: The chart shows a cyclic temperature and humidity test profile. Relative humidity is constant at 95% throughout the 56-hour period shown. The temperature follows a ramp-up, soak, ramp-down, and cold-dwell pattern over 24-hour cycles.
Figure 507.6-7. Aggravated temperature-humidity cycle.
Notes
- Maintain the relative humidity at 95 ±4 percent at all times except that during the descending temperature periods the relative humidity may drop to as low as 85 percent.
- A cycle is 24 hours.
- Perform operational checks near the end of the fifth and tenth cycles.
| Time | Temp. | RH Percent | |
|---|---|---|---|
| °C | °F | ||
| 0000 | 30 | 86 | |
| 0200 | 60 | 140 | |
| 0800 | 60 | 140 | |
| 1600 | 30 | 86 | |
| 2400 | 30 | 86 | |
| 0200 | 60 | 140 | |
| 0800 | 60 | 140 | Constant at 95 percent |
| 1600 | 30 | 86 | |
| 2400 | 30 | 86 | |