| MISSION TYPE | AIRCRAFT TYPE | % OF SORTIES |
|---|---|---|
| 1. Patrol Mission I | Fighter A | 50 |
| Fighter B | 30 | |
| 2. Patrol Mission II | Fighter A | 20 |
| Fighter B | 20 | |
| 3. Strike Escort Mission | Fighter A | 30 |
| Fighter B | 30 | |
| 4. Strike Mission | Fighter B | 20 |
523.4A -II. Mission phase analysis (Fighter B, strike mission)
| MISSION PHASE | MACH NUMBER | ALTITUDE (km) | DURATION (min.) | ADDITIONAL FACTORS | DUTY CYCLE OF STORE |
|---|---|---|---|---|---|
| Takeoff & Climb | Catapult Shock? | Off to Ready | |||
| Cruise | Ready | ||||
| Refuel | Ready | ||||
| Ingress | On (Radiate) | ||||
| Attack | Buffet? | Ready | |||
| Return | Ready | ||||
| Refuel | Ready | ||||
| Descend & Land | Landing Shock? | Off |
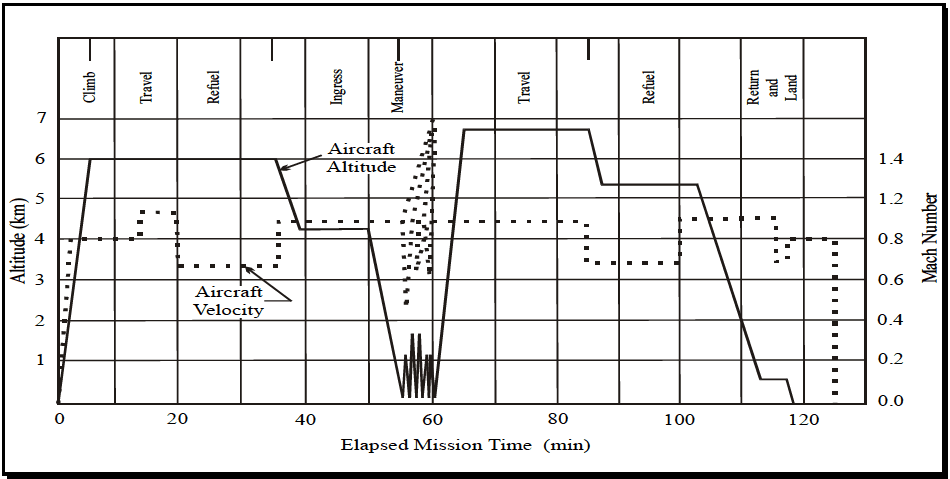
Figure description:
Aircraft Mission Profile Mission Profile Visualization
Aircraft Altitude and Velocity vs. Elapsed Mission Time
Legend
- Aircraft Altitude — color: black; symbol: Solid line
- Aircraft Velocity — color: black; symbol: Dotted line
Annotations
- Climb (text_label - position: x = 2.5, top)
- Travel (text_label - position: x = 9.5, top)
- Refuel (text_label - position: x = 17, top)
- Ingress (text_label - position: x = 42.5, top)
- Maneuver (text_label - position: x = 55, top)
- Travel (text_label - position: x = 72.5, top)
- Refuel (text_label - position: x = 94, top)
- Return and Land (text_label - position: x = 114.5, top)
- Aircraft Altitude (text_label - position: x = 40, y = 5.7)
- Aircraft Velocity (text_label - position: x = 30, y = 3.3)
| Elapsed Mission Time (min) | Aircraft Altitude (km) | Mach Number |
|---|---|---|
| 0 | 0.0 | 0.00 |
| 3 | 3.6 | 0.80 |
| 5 | 6.0 | 0.80 |
| 13 | 6.0 | 0.80 |
| 14 | 6.0 | 0.94 |
| 20 | 6.0 | 0.94 |
| 21 | 6.0 | 0.67 |
| 35 | 6.0 | 0.67 |
| 36 | 5.5 | 0.88 |
| 39 | 4.2 | 0.88 |
| 50 | 4.2 | 0.88 |
| 55 | 0.0 | 0.88 |
| 55.5 | 1.6 | 0.40 |
| 56.5 | 0.0 | 1.10 |
| 57.5 | 1.6 | 0.70 |
| 58.5 | 0.0 | 1.30 |
| 59.5 | 1.6 | 0.90 |
| 60 | 0.0 | 0.88 |
| 65 | 6.7 | 0.88 |
| 83 | 6.7 | 0.88 |
| 85 | 6.7 | 0.70 |
| 87 | 5.3 | 0.70 |
| 100 | 5.3 | 0.70 |
| 102 | 5.3 | 0.90 |
| 103 | 5.3 | 0.90 |
| 113 | 0.7 | 0.90 |
| 115 | 0.7 | 0.90 |
| 116 | 0.7 | 0.80 |
| 118 | 0.7 | 0.80 |
| 119 | 0.0 | 0.80 |
| 125 | 0.0 | 0.80 |
| 126 | 0.0 | 0.00 |
Notes: The Maneuver phase between 50 and 60 minutes features rapid oscillations in both altitude and velocity. Altitude peaks at approximately 1.6 km while velocity (Mach Number peaks at 1.4.)
Figure 523.4A-1. Typical aircraft operational mission profile.
523.4A -III. Temperature offsets
| STEP | PERCENTILE | OFFSET | GROUND TEMPERATURE |
|---|---|---|---|
| 3 | 6.25 | -30.8°C | -18.8°C (-2°F) |
| 2 | 18.75 | -13.3°C | -1.3°C (30°F) |
| 4 | 31.25 | -7.2°C | 4.8°C (41°F) |
| 1 | 43.75 | -2.4°C | 9.6°C (49°F) |
| 5 | 56.25 | +2.4°C | 14.4°C (58°F) |
| 8 | 68.75 | +7.2°C | 19.2°C (67°F) |
| 6 | 81.25 | +13.3°C | 25.5°C (78°F) |
| 7 | 93.75 | +30.8°C | 43.0°C (109°F) |
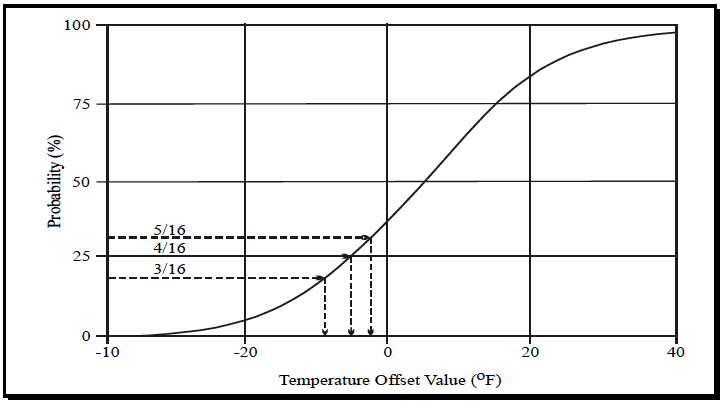
Figure description:
Probability vs. Temperature Offset Value
Annotations
- 5/16 (text_label - position: y = 31.25%)
- 4/16 (text_label - position: y = 25.0%)
- 3/16 (text_label - position: y = 18.75%)
- y = 5/16 reference line (horizontal_line - position: y = 31.25%)
- y = 4/16 reference line (horizontal_line - position: y = 25.0%)
- y = 3/16 reference line (horizontal_line - position: y = 18.75%)
- x-intercept for y = 5/16 (vertical_line - position: x ≈ -2.5)
- x-intercept for y = 4/16 (vertical_line - position: x ≈ -5.0)
- x-intercept for y = 3/16 (vertical_line - position: x ≈ -9.0)
| Temperature Offset Value (°F) | Probability (%) |
|---|---|
| -40 | 0.0 |
| -30 | 1.5 |
| -20 | 5.0 |
| -10 | 16.5 |
| -9.0 | 18.75 |
| -5.0 | 25.0 |
| -2.5 | 31.25 |
| 0 | 38.0 |
| 5 | 50.0 |
| 10 | 65.0 |
| 15 | 77.0 |
| 20 | 85.0 |
| 25 | 92.0 |
| 30 | 95.0 |
| 35 | 97.0 |
| 40 | 98.5 |
Notes: The chart represents a cumulative probability distribution of temperature offset values. Specific annotations highlight the probabilities of 3/16, 4/16, and 5/16 and their corresponding temperature offset values.
Figure 523.4A-4. Selection of equi-probable temperatures from the cumulative distribution of climatic temperatures.
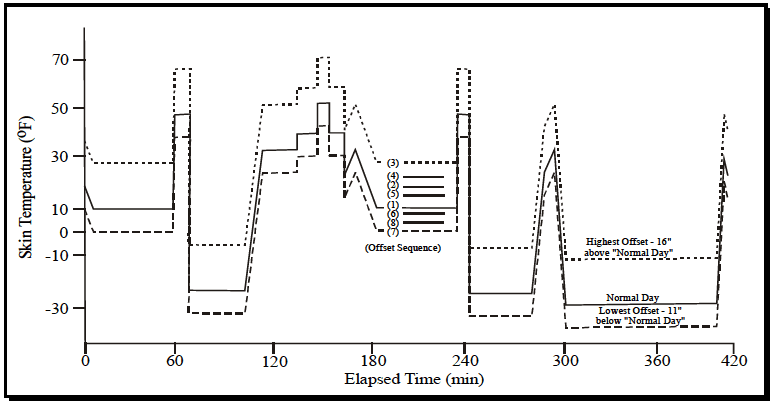
Figure description:
Skin Temperature Profile
Skin Temperature (°F vs Elapsed Time (min
Legend
- Normal Day — color: black; symbol: Solid line
- Highest Offset — color: black; symbol: Dotted line
- Lowest Offset — color: black; symbol: Dashed line
Annotations
- (Offset Sequence: (3, (4, (2, (5, (1, (6, (8, (7 (text_label - position: Centered around x = 200, y = 10))))))))))
- Highest Offset - 16" above "Normal Day" (text_label - position: Right side, near y = -10)
- Normal Day (text_label - position: Right side, near y = -25)
- Lowest Offset - 11" below "Normal Day" (text_label - position: Right side, near y = -35)
| Elapsed Time (min) | Normal Day (°F) | Highest Offset (+16°F) | Lowest Offset (-11°F) |
|---|---|---|---|
| 0 | 18 | 34 | 7 |
| 10 | 10 | 26 | -1 |
| 60 | 10 | 26 | -1 |
| 60 | 48 | 64 | 37 |
| 65 | 48 | 64 | 37 |
| 65 | 38 | 54 | 27 |
| 70 | 38 | 54 | 27 |
| 70 | -24 | -8 | -35 |
| 105 | -24 | -8 | -35 |
| 115 | 33 | 49 | 22 |
| 135 | 33 | 49 | 22 |
| 145 | 40 | 56 | 29 |
| 155 | 52 | 68 | 41 |
| 165 | 40 | 56 | 29 |
| 170 | 22 | 38 | 11 |
| 175 | 33 | 49 | 22 |
| 185 | 11 | 27 | 0 |
| 235 | 11 | 27 | 0 |
| 235 | 48 | 64 | 37 |
| 240 | 48 | 64 | 37 |
| 240 | 38 | 54 | 27 |
| 245 | 38 | 54 | 27 |
| 245 | -25 | -9 | -36 |
| 280 | -25 | -9 | -36 |
| 295 | 33 | 49 | 22 |
| 300 | -29 | -13 | -40 |
| 405 | -29 | -13 | -40 |
| 410 | 32 | 48 | 21 |
| 415 | 23 | 39 | 12 |
Notes: The chart shows a sequence of skin temperature changes over time. The 'Normal Day' line serves as a baseline, with 'Highest' and 'Lowest' offset lines plotted at +16°F and -11°F respectively. Intermediate offset lines are partially visible in some segments and are identified by the '(Offset Sequence' labels (1 through (8 in the middle of the plot.)))
Figure 523.4A-5. Climatic set plan showing offset sequences.