Tailor the following paragraphs as appropriate for the individual program.
514.8-4 NATURE OF VIBRATION
For VSD purposes, vibration can generally be classified in one of three categories. The category of vibration can affect the analysis techniques or test methods.
Sinusoidal – Vibration at a single frequency, typically of constant amplitude. Depending on the source of the
MIL-STD-810H
vibration, the frequency might remain constant (dwell) or change (sweep) over a pre-defined bandwidth.
Broadband Random – Vibration is simultaneously present at all frequencies over a wide bandwidth. The amplitude may vary significantly over the full bandwidth.
Narrowband Random – Vibration is simultaneously present over a narrow bandwidth of frequencies. Narrowband vibration is typically defined by a center frequency, a bandwidth, and amplitude. As with sinusoidal vibration, the frequency of the narrowbands is sometimes constant and sometimes swept.
An item will often undergo more than one category of vibration simultaneously. Most modern vibration test systems can produce broadband random, pure sinusoidal, sine-on-random (SOR), and narrowband random-on-random (NBROR) vibration. The sinusoids and narrowbands can either dwell or sweep.
In the field, narrowband energy is rarely pure sinusoidal or pure narrow-band random, but is more commonly a combination of the two. Unfortunately, most vibration control systems can produce either narrowband random or sine vibration at a given frequency, but not both. For that reason it is necessary to determine if the vibration of interest is more nearly sinusoidal or narrowband random in nature. This can be difficult as the leakage in ASD calculation often makes sinusoidal vibration appear to be narrowband random. One method of differentiating between sinusoidal and narrowband random data is the width of harmonically related spectral spikes. If the vibration is sinusoidal the width is a result of ASD leakage and will remain nearly constant in the harmonics. However, if the vibration is narrowband the widths will be harmonically related. Histograms and band-pass filter time histories are also helpful in determining the nature of spectral spikes.
514.8-4 DATA ACQUISITION PROCEDURE
514.8-4 SINE TONE SPECIFICATION DEVELOPMENT PROCEDURE
The procedures for sine tone development are similar to those for narrowband random development. A sample sine tone spreadsheet is provided in Table 514.8F-D.VIII. The sample is of the same wheeled vehicle on the 2-Inch Washboard Course as the narrowband random example. Three tones were removed from each of three events (5, 7.5 and 10 mph). The following paragraphs provide a column-by-column description of the sine tone processing procedures.
MIL-STD-810H METHOD 514.8, ANNEX F, APPENDIX D Table 514.8F-D.VIII. Sine Tone Calculations
| Tone Information | Sine Tone Calculations | |||||||||||||
|---|---|---|---|---|---|---|---|---|---|---|---|---|---|---|
| Event | Speed on 2" WB | Sine Tone Freq Selected | Time from Adj Beta Di | Actual Test Time | Total g-rms of Tone ASD(Avg) | Sine G- Peak | Sine Peak Adjusted to Test Time | Sine Test Level | MAX Disp (inch Pk-Pk) | Disp Warn [ ] | Max Vel in/sec | Raw Data Vel [ ] | Ratio Adj Peak [ ] | Ratio Check |
| TONE 1 INFO | ||||||||||||||
| 5 mph 2" WB | 5 | 3.67 | 55.41 | 30 | 0.218 | 3.09E-01 | 3.40E-01 | 4.08E-01 | 0.59 | 6.8 | 5.17 | 1.10 | ||
| 7.5 mph 2" WB | 7.5 | 5.50 | 141.88 | 60 | 0.245 | 3.47E-01 | 3.98E-01 | 4.78E-01 | 0.31 | 5.3 | 3.88 | 1.15 | ||
| 10 mph 2" WB | 10 | 7.33 | 49.80 | 30 | 0.406 | 5.74E-01 | 6.22E-01 | 7.47E-01 | 0.27 | 6.3 | 4.81 | 1.08 | ||
| TONE 2 INFO | ||||||||||||||
| 5 mph 2" WB | 5 | 7.33 | 55.41 | 30 | 0.089 | 1.25E-01 | 1.38E-01 | 1.66E-01 | 0.06 | 1.4 | 1.05 | 1.10 | ||
| 7.5 mph 2" WB | 7.5 | 11.00 | 141.88 | 60 | 0.244 | 3.45E-01 | 3.96E-01 | 4.75E-01 | 0.08 | 2.7 | 1.93 | 1.15 | ||
| 10 mph 2" WB | 10 | 14.67 | 49.80 | 30 | 0.294 | 4.16E-01 | 4.51E-01 | 5.42E-01 | 0.05 | 2.3 | 1.74 | 1.08 | ||
| TONE 3 INFO | ||||||||||||||
| 5 mph 2" WB | 5 | 11.00 | 55.41 | 30 | 0.192 | 2.72E-01 | 3.00E-01 | 3.60E-01 | 0.06 | 2.0 | 1.52 | 1.10 | ||
| 7.5 mph 2" WB | 7.5 | 16.50 | 141.88 | 60 | 0.121 | 1.71E-01 | 1.96E-01 | 2.35E-01 | 0.02 | [ ] | 0.9 | 0.64 | 1.15 | |
| 10 mph 2" WB | 10 | 22.00 | 49.80 | 30 | 0.173 | 2.44E-01 | 2.65E-01 | 3.17E-01 | 0.01 | [ ] | 0.9 | 0.68 | 1.08 | [ ] |
MIL-STD-810H METHOD 514.8, ANNEX F, APPENDIX D
4.1 Event (Col. A) – Same as paragraph 3.1.
4.2 Speed on 2” WB (Col. B) – Same as paragraph 3.2.
4.3 Sine Tone Frequency Selected (Col. C) – Same as paragraph 3.3, except instead of the center frequency of a narrowband tone it is a single frequency of a sine tone.
514.8-4 RANDOM VIBRATION EXCITATION
The MRS is calculated by considering the average number of times a threshold of the response is exceeded with a positive slope for a time T. This number is given by the following equation for a Gaussian vibration:
MIL-STD-810H METHOD 514.8, ANNEX F, APPENDIX E
Considering a threshold which is exceeded only once on the average, and setting
which provides:
Example: MRS for a random vibration (Figure 514.8F-E.3) defined by:
| 100 - 300 Hz | 0.5 | g²/Hz |
| 300 - 600 Hz | 1 | g²/Hz |
| 600 - 1200 Hz | 0.2 | g²/Hz |
Q=10
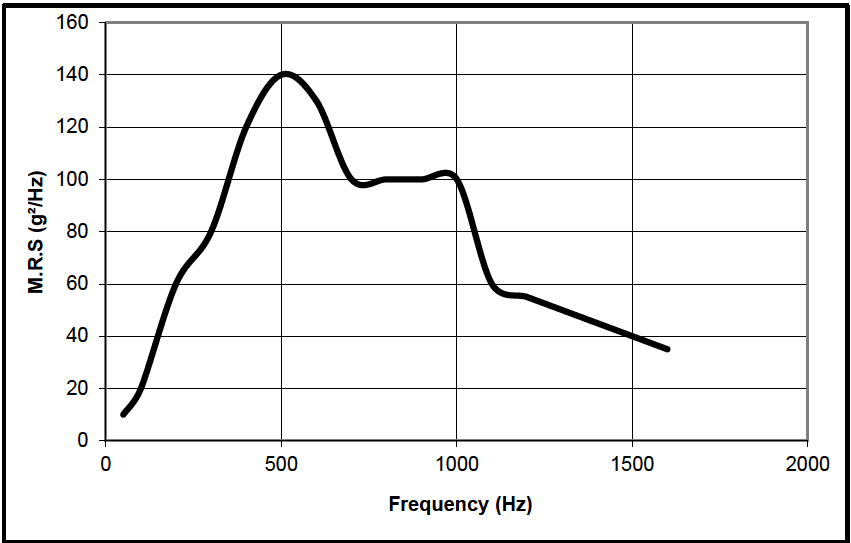
Figure description:
| Frequency (Hz) | M.R.S (g²/Hz) |
|---|---|
| 50 | 10 |
| 100 | 20 |
| 150 | 45 |
| 200 | 62 |
| 250 | 72 |
| 300 | 80 |
| 350 | 100 |
| 400 | 120 |
| 450 | 135 |
| 500 | 140 |
| 550 | 137 |
| 600 | 125 |
| 650 | 110 |
| 700 | 100 |
| 750 | 98 |
| 800 | 100 |
| 850 | 100 |
| 900 | 100 |
| 950 | 102 |
| 1000 | 100 |
| 1050 | 80 |
| 1100 | 60 |
| 1150 | 56 |
| 1200 | 55 |
| 1300 | 50 |
| 1400 | 45 |
| 1500 | 40 |
| 1600 | 35 |
Notes: The chart displays a power spectral density profile, with the y-axis representing Mean Root Square (M.R.S in units of g²/Hz and the x-axis representing Frequency in Hz. The plot shows a primary peak at 500 Hz with a magnitude of 140 g²/Hz and a plateau region between approximately 700 Hz and 1000 Hz at around 100 g²/Hz.)
Figure 514.8F-E.3. MRS for a random vibration.
Downloaded from https://www.everyspec.com
MIL-STD-810H
METHOD 514.8, ANNEX F, APPENDIX E
(This page is intentionally blank.)
MIL-STD-810H
METHOD 514.8, ANNEX F, APPENDIX F
METHOD 514.8, ANNEX F, APPENDIX F References
- a. NATO Allied Environmental Conditions and Test Publication (AECTP) 100 Environmental Guidelines For Defence Materiel, Edition 4; May 2009
- b. International Test Operating Procedure (ITOP) 1-1-050. Development of Laboratory Vibration Test Schedules. 6 June 1997. DTIC AD No B227368
- c. Test Operations Procedure (TOP) 01-2-601, Ground Vehicle Laboratory Vibration Schedules. 18 May 2015.
- d. Harris, Cyril M., Allan G. Piersol, , Shock and Vibration Handbook, McGraw-Hill Book Company, Fifth Edition, ISBN 0-07-137081-1, 2002
- e. Bendat, Julius S., Allan G. Piersol, Random Data Analysis and Measurement Procedures Wiley Interscience, Third Edition, ISBN 978-0-471-31733-3, 2000.
- f. Henderson, George R. and Allan G. Piersol, Fatigue Damage Related Descriptor for Random Vibration Test Environments, Sound and Vibration, October 1995.
- g. Piersol, Allan G., Determination of Maximum Structural Responses From Predictions or Measurements at Selected Points, Proceedings of the 65th Shock and Vibration Symposium, Volume I, SAVIAC, 1994. Shock and Vibration Exchange; 1104 Arvon Road; PO Box 165; Arvonia, VA 23004; http://www.savecenter.org.
- h. Curtis, Allen J., Nicholas G. Tinling, Henry T. Abstein, Selection and Performance of Vibration Tests, Shock and Vibration Information Center, SVM-8 1971.
- i. Structural Alloys Handbook, Mechanical Properties Data Center, Belfour-Stulen, Inc., Traverse City, MI, 1977 edition.
- j. Robinson, John A. and Harry T. Cline, Methodology Investigation, Final Report, Cargo Configuration and Restraint in Military Ground Vehicles, TECOM Project No. 7-CO-R08-AP1-002; APG Report No. APG- MT-5319, November 1979.
- k. Baily, Richard D. and Spectral Dynamics Research Corporation, Methodology Investigation, Final Report, Determination of the Effective Mass of Cargo Beds, TECOM Project No. 7-CO-RD9-AP1-001, APG Report APG-MT-5572, December 1981.
- l. Handbook for Dynamic Data Acquisition and Analysis, IEST-RD-DTE012.2; Institute of Environmental Sciences and Technology, Arlington Place One, 2340 S. Arlington Heights Road, Suite 100, Arlington Heights, IL 60005-4516; http://www.iest.org.
- m. NATO Allied Environmental Conditions and Test Publication (AECTP) 240, Mechanical Environmental Testing. July 2009
- n. Connon, William, To ‘b’ or Not to ‘b’ - What was the question?, IEST ESTECH Proceedings May 2009, Institute of Environmental Sciences and Technology, Arlington Place One, 2340 S. Arlington Heights Road, Suite 100, Arlington Heights, IL 60005-4516; http://www.iest.org.
- o. ETBX Strain-Life Fatigue Analysis Module, 5 November 2008.
- p. Defence Standard (Def Stan) 00-35, Environmental Handbook for Defence Materiel, Issue 4, 28 March 2018.
- q. TOP 01-2-603, Rotorcraft Laboratory Vibration Schedules, 12 June 2017; DTIC AD No. AD1035102.
- r. Test Operations Procedure (TOP) 01-1-011B, Vehicle Test Facilities at Aberdeen Test Center Yuma Test Center, 12 December 2017; DTIC AD No. AD1043599.
Downloaded from https://www.everyspec.com
MIL-STD-810H
METHOD 514.8, ANNEX F, APPENDIX F
(This page is intentionally blank.)
MIL-STD-810H METHOD
4.1 Test Facility
Use a test facility, including all auxiliary equipment, capable of providing the specified vibration environments and the control strategies and tolerances discussed in paragraph 4.2. In addition, use measurement transducers, data recording and data reduction equipment capable of measuring, recording, analyzing, and displaying data sufficient to document the test and to acquire any additional data required. Unless otherwise specified, perform the specified vibration tests and take measurements at standard ambient conditions as specified in Part One, paragraph 5.1.
514.8-4.1 Data Acquisition
There are several commercially available data acquisition systems that are capable of measuring and recording vibration data that would be suitable for VSD. The user needs to insure that the signal conditioning including the filter, sample rate and analog-to-digital converter (ADC) fidelity are acceptable for the measurements being made. For example an 8-pole (48 dB/octave, 160 dB/decade) Butterworth filter would require a sample rate of approximately four times the filter frequency to minimize aliasing.
4.1.1 Procedure I - General vibration
This procedure uses standard laboratory vibration exciters (shakers), slip tables, and fixtures. Choose the specific exciters to be used based on:
- a. the size and mass of test items and fixtures;
MIL-STD-810H
METHOD 514.8
- b. the frequency range required;
- c. the force, acceleration, velocity, and displacement required.
4.1.2 Procedure II - Loose cargo transportation
Simulation of this environment requires use of a package tester (Annex C, Figure 514.8C-8) that imparts a 25.4 mm (1.0 inch) peak-to-peak, circular synchronous motion to the table at a frequency of 5 Hz. This motion takes place in a vertical plane. The figure shows the required fixturing. This fixturing does not secure the test item(s) to the bed of the package tester. Ensure the package tester is large enough for the specific test item(s) (dimensions and weight).
4.1.3 Procedure III - Large assembly transport
The test facility for this Procedure is a test surface(s) and vehicle(s) representative of transportation and/or service phases of the environmental life cycle. The test item is loaded on the vehicle and secured or mounted to represent the life cycle event. The vehicle is then driven over the test surface in a manner that reproduces the transportation or service conditions. The test surfaces may include designed test tracks (e.g., test surfaces at the US Army Aberdeen Test Center (paragraph 6.1, reference b), typical highways, or specific highways between given points (e.g., a specified route between a manufacturing facility and a military depot)). Potentially, such testing can include all environmental factors (vibration, shock, temperature, humidity, pressure, etc.) related to wheeled vehicle transport.
4.1.4 Procedure IV - Assembled aircraft store captive carriage and free flight
This procedure uses standard laboratory vibration exciters (shakers) driving the test item directly or through a fixture. The test item is supported by a test frame independent of the vibration exciters (see paragraph 4.4.4). Select the specific exciters based on size and mass of test items and fixtures, frequency range, and low frequency stroke length (displacement) required.
4.2 Controls, Tolerances, and Instrumentation
The accuracy in providing and measuring vibration environments is highly dependent on fixtures and mountings for the test item, the measurement system and the exciter control strategy. Ensure all instrumentation considerations are in accordance with the best practices available (see paragraph 6.1, reference c). Careful design of the test set up, fixtures, transducer mountings and wiring, along with good quality control will be necessary to meet the tolerances of paragraph 4.2.2 below.
514.8-4.2 Cargo Schedules
- a. Attach tri-axial accelerometers to the structural members of the cargo bed in order to measure the vibration environment along three mutually perpendicular axes usually noted as vertical (V), transverse (T), and longitudinal (L). Normally, this orientation is relative to the axes of the vehicle, i.e., vertical is up/down, transverse is side/side, and longitudinal is front/rear. This is not mandatory but tends to be least confusing.
- b. Check tie-down.
- c. Insure that instrumentation is working properly and all transducers are calibrated.
- d. Operate the vehicle at the prescribed speed(s) over the designated fixed profile courses, and record the data.
4.2.1 Control strategy
For Procedures I and IV, select a control strategy that will provide the required vibration at the required location(s) in or on the test item. Base this selection on the characteristics of the vibration to be generated and platform/materiel interaction (see paragraph 1.3b above and Annex A, paragraph 2.4). Generally, a single strategy is appropriate. There are cases where multiple strategies are used simultaneously.
4.2.1.1 Acceleration input control strategy
The vibration excitation is controlled to within specified bounds by sampling the vibratory motion of the test item at specific locations. These locations may be at, or in close proximity to, the test item fixing points (controlled input) or at defined points on the test item (controlled response). The vibratory motions may be sampled at a single point (single point control), or at several locations (multi-point control). The control strategy will be specified in the Test Plan. However, it should be noted that it could be influenced by:
- a. The results of preliminary vibration surveys carried out on materiel and fixtures;
- b. Meeting the test specifications within the tolerances of paragraph 4.2.2;
- c. The capability of the test facility.
In view of the possibility of frequency drift, it is essential when conducting fixed frequency sinusoidal "resonance dwell" tests that the frequency be constantly adjusted to ensure a maximum response. Two methods are available:
- a. Search for the maximum dynamic response;
- b. Maintain the phase between the control and monitoring points.
MIL-STD-810H
METHOD 514.8
4.2.1.1.1 Single Point Control Option
This option can be used when the preliminary vibration survey indicates a rigid vibration fixture, or when one control accelerometer accurately represents an average of the inputs at each fixing point. However, given the increased risk associated with transducer or instrumentation failure and/or calibration or scaling error attributable to a single channel, this option is not recommended. A single control point is selected:
- a. Either from among the fixing points;
- b. Or, in such a way that it provides the best possible solution for achieving the tolerances at the fixing points.
4.2.1.1.2 Multiple Point Control (average) Option
This option can be used when the preliminary vibration survey shows that inputs to the test item vary significantly between fixing points. The control points, usually two or three, will be selected using the same criteria listed in paragraph 4.2.1.1.1 for the single control point option. However, the control for:
- a. Random will be based on the average of the ASD of the control points selected.
- b. Sine will be based on the average of the peak response values of the control points selected.
4.2.1.1.3 Multiple Point Control (maximum) Option
This option can be used when responses are not to exceed given values, but care is needed to avoid an undertest. Preliminary vibration survey results are used to aid the definition of the control points on the test item at which maximum response motions occur. The control points, usually two or three, will be selected using the same criteria listed in paragraph 4.2.1.1.1 for the single point option. However, the control for:
- a. Random, will be based on the maximum spectrum response at any of the selected control points.
- b. Sine, will be based on the maximum peak response at any of the selected control points.
4.2.1.2 Force control strategy
Dynamic force gages are mounted between the exciter/fixture and the test item. Exciter motion is controlled with feedback from the force gages to replicate field measured interface forces. This strategy is used where the field (platform/materiel) dynamic interaction is significantly different from the laboratory (exciter/test item) dynamic interaction. This form of control inputs the correct field-measured forces at the interface of the laboratory vibration exciter and test item. This strategy is used to prevent overtest or undertest of materiel mounts at the lowest structural resonances that may otherwise occur with other forms of control.
4.2.1.3 Acceleration limit strategy
Input vibration criteria are defined as in paragraph 4.2.1.1. In addition, vibration response limits at specific points on the materiel are defined (typically based on field measurements). Monitoring transducers (typically accelerometers or strain gages) are located at these points. The test item is excited as in paragraph 4.2.1.1 using test item mounting point accelerometer signals to control the exciters. The input criteria are experimentally modified as needed to limit responses at the monitoring transducers to the predefined limits. Changes to the specified input criteria are limited in frequency bandwidth and in level to the minimum needed to achieve the required limits.
4.2.1.4 Acceleration response control strategy
Vibration criteria are specified for specific points on, or within the test item. Control accelerometers are mounted at the vibration exciter/fixture interface. Monitoring accelerometers are mounted at the specified points within the item. Low level vibration, controlled with feedback from the control accelerometers is input to the test item. The input vibration is experimentally adjusted until the specified levels are achieved at the monitoring accelerometers. This strategy is commonly used with assembled aircraft stores where store response to the dynamic environment is measured or estimated. It is also applicable for other materiel when field measured response data are available.
4.2.1.5 Waveform control strategy
This strategy is discussed in Methods 525.1 and 527.1.
MIL-STD-810H
METHOD 514.8
4.2.2 Tolerances
Use the following tolerances unless otherwise specified. In cases where these tolerances cannot be met, achievable tolerances should be established and agreed to by the cognizant engineering authority and the customer prior to initiation of test. Protect measurement transducer(s) to prevent contact with surfaces other than the mounting surface(s).
4.2.2.1 Acceleration spectral density
The test facility should be capable of exciting the test item to the random vibration conditions specified in the Test Plan. The motion induced by the random vibration should be such that the fixing points of the test item move substantially parallel to the axis of excitation. In these conditions the amplitudes of motion should exhibit a normal distribution. The tolerances defined in Table 514.8-II below should be used and checked with the test item installed. The tolerances associated with the test severity parameters are not to be used to overtest or undertest the test item. Any deviations to the test or test tolerances from the values in Table 514.8-II must be approved by the appropriate test authority and must be clearly documented. In addition to the tolerances specified in Table 514.8-II, the following factors should also be considered:
-
a. Vibration environment. The following discussion relates the measured vibration level to the specification level and, like the control system, does not consider any measurement uncertainty. The test tolerance should be kept to the minimum level possible considering the test item, fixturing and spectral shape. Test tolerances of less than ±3 dB are usually readily attainable with small, compact test items (such as small and medium sized rectangular electronic packages), well-designed fixtures, and modern control equipment. When test items are large or heavy, when fixture resonances cannot be eliminated, or when steep slopes (>20 dB/octave) occur in the spectrum, these tolerances may have to be increased. When increases are required, exercise care to ensure the selected tolerances are the minimum attainable, and that attainable tolerances are compatible with test objectives.
-
b. Vibration measurement. Use a vibration measurement system that can provide acceleration spectral density measurements within ±0.5 dB of the vibration level at the transducer mounting surface (or transducer target mounting surface) over the required frequency range. Do not use a measurement bandwidth that exceeds 2.5 Hz at 25 Hz or below, or 5 Hz at frequencies above 25 Hz. Use a frequency resolution appropriate for the application (i.e., generally in wheeled vehicles a resolution of 1 Hz is sufficient).
-
c. Statistical degrees of freedom. Since the control loop time depends on the number of degrees of freedom and on the analysis and overall bandwidths, it is important to select these parameters so that test tolerances and control accuracy can be achieved. If possible, ensure the number of statistical degrees of freedom is greater than 120. Swept narrow-band random on random vibration tests may require lesser degrees of freedom due to sweep time constraints.
-
d. Root mean square (RMS) "g." Do not use RMS g as the sole parameter defining or controlling vibration tests because it contains no spectral information. RMS levels are useful in monitoring vibration tests since RMS can be monitored continuously, whereas measured spectra are available on a delayed, periodic basis. Also, RMS values are sometimes useful in detecting errors in test spectra definition. Do not use random vibration RMS g as a comparison with sinusoidal peak g. These values are unrelated.
-
e. When possible, an identical analysis bandwidth should be used for both control and monitoring. When this is not possible, adequate allowance should be made to the results of the monitoring analysis.
-
f. For swept narrow band random tests, the tolerances on the swept components of the test requirement should, wherever possible, be the same as for a wide band random component. However, at some sweep rates, these tolerances may not be achievable. Therefore, the tolerance requirements for these components shall be stated in the Test Plan.
-
g. The complete test control system including checking, servoing, recording, etc., should not produce uncertainties exceeding one third of the tolerances listed in Table 514.8-II.
-
h. The tolerances associated with the test severity parameters are not to be used to overtest or undertest the test item. If tolerances are not met, the difference observed should be noted in the test report.
Table 514.8-II. Random Vibration Test Tolerances
Specific Tolerances For All Random Vibration Tests (including the broadband component of mixed random and sinusoidal vibration tests and the fixed and swept narrowband components of mixed broadband and narrowband random vibration tests)
| Parameter | Tolerance | |
|---|---|---|
| Number (n) of independent statistical degrees of freedom (DOF) for control of the specified ASD. | n > 120 | |
| Composite Control: Maximum deviation of the composite control ASD in relation to the specified ASD.1 | ± 3 dB below 500 Hz ± 6 dB above 500 Hz ± 10% overall grms | |
| Multi-point Control: Maximum deviation of any individual control channel ASD in relation to the specified ASD.2 | Average Control ± 6 dB below 500 Hz ± 9 dB above 500 Hz | Extremal Control - 6 dB / + 3 dB below 500 Hz - 9 dB / + 6 dB above 500 Hz ± 25% overall grms |
| Cross-axis Motion: ASD measured with the same number of DOF as in the test axis, along the mutually orthogonal directions, in relation to the in-axis specified ASD. | Less than 50% below 500 Hz Less than 100% above 500 Hz Less than the relevant specified ASD for the given cross-axis. | |
| Frequency sweep rate | ± 10% of stated rate | |
| Test time duration | ± 5% of stated duration | |
| Amplitude distribution of the instantaneous values of the random vibration measured at the drive signal. | Nominally Gaussian (Refer to paragraph 2.4 for amplitude distribution discussion) | |
Composite Control is defined as: The ASD computed as either the average, maximum, or minimum (depending on control method) of all feedback channels deemed as control channels in a multi-point control scenario or the single control channel in a single-point control scenario. As discussed in paragraph 4.2.1.1 multi-point control is encouraged.
- ² If using minimum control, the negative tolerance will be that of the Composite Control.
The default assumption for all ASD references provided in this document is that the associated probability density function (pdf) is of Gaussian form. Generally, unless documentation from field data indicates otherwise, the drive-limiting option (often referred to as three-sigma clipping) should not be invoked. However, it is recognized that there are scenarios such as test equipment displacement limitations or power amplifier voltage or current limitations that could be resolved by invoking the drive limiting control parameter. When invoking the drive signal limiting feature on a Gaussian drive signal, the limiting threshold should never be set to less than three standard deviations (3-sigma). In addition, the test engineer or program engineer responsible for the test article should approve the operation and it should be properly documented within the test report.
When an ASD is being generated to serve as a reference for a vibration test, careful examination of field measured response probability density information should be performed. The probability density/distribution function should be estimated and compared with that of a theoretical Gaussian probability density/distribution. If there is strong evidence of departure from the Gaussian distribution then an accurate estimate of the higher moments – primarily kurtosis and skewness should be made, cognizant of the substantial increased amount of measurement information needed to estimate higher order moments accurately. Skewness and kurtosis are the third and fourth standardized moments about the mean computed as:
MIL-STD-810H
METHOD 514.8
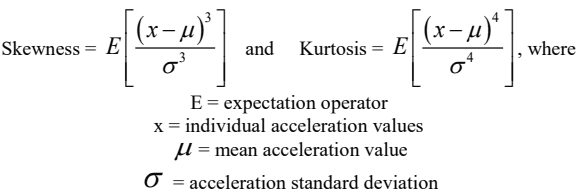
Figure description:
Mathematical Formulas and Definitions
- Skewness:
- Kurtosis:
Variables:
- E: Expectation operator
- x: Individual acceleration values
- : Mean acceleration value
- : Acceleration standard deviation
A Gaussian process has a skewness equal to 0 and a kurtosis equal to 3. Skewness is a measure of the asymmetry of the probability distribution of a random variable while kurtosis is a measure of “peakedness” or “flatness” of the distribution.
If analysis shows the data to be highly non-Gaussian, one may consider either of the following:
- (1) Employing TWR techniques (that will generally preserve the measured pdf and the distribution in time of the time history characteristics e.g., peaks and valleys, that provide for kurtosis differing from the Gaussian theoretical value).
- (2) Employing a control algorithm capable of drive signal synthesis per user defined kurtosis and “matching” the measurement pdf within some level of statistical confidence. All control systems do not necessarily assume the same model for generating non-Gaussian input and most control system software ignore the form of the pdf. Use of a control system that does not take account of the form of the pdf is discouraged unless it can be demonstrated that the pdf of the synthesized data is comparable (via statistical test) to that of the measured data upon which the test reference is based. This assumes a single measured test reference with non-Gaussian behavior. When several measured test references are present the overall non-Gaussian behavior may be due to “mixture distribution” effects, in which case an analyst must be consulted for recommendations as to a way to proceed.
In the event TWR or user defined kurtosis options as defined above are employed to address non-Gaussian scenarios, the time compression techniques outlined in Annex A paragraph 2.2 are not applicable.
The test engineer or program engineer responsible for the test article should approve any deviation from the standard Gaussian process and any deviations should be properly documented within the test report by time history plots, skewness/kurtosis estimates and probability density function estimate plots.
4.2.2.2 Peak sinusoidal acceleration
The test facility should be able to excite the materiel as specified in the Test Plan. The motion should be sinusoidal and such that the fixing points of the test item move substantially in phase with and parallel to the excitation axis. The sinusoidal tolerances and related characteristics defined in Table 514.8-III should be used and checked with the test item installed. Only under exceptional circumstances should a Test Plan need to specify different tolerances. The complete test control system should not produce uncertainties exceeding one third of the tolerances listed in Table 514.8-III. The tolerances associated with the test severity parameters are not to be used to overtest or undertest the test item. If tolerances are not met, the difference observed should be noted in the test report.
Table 514.8-III. Sinusoidal Vibration Test Tolerances
Specific Tolerances For All Sinusoidal Tests (including fixed, swept and stepped sine tests as well as the fixed and swept sinusoidal components of mixed random and sinusoidal tests)
| Parameter | Tolerance | |
|---|---|---|
| Frequency | ± 0.1 % | |
| Composite Control: Maximum deviation of the composite control1 tone level(s) in relation to the specified tone level(s). | ± 10% | |
| Multi-point Control: Maximum deviation of the individual control channel tone levels in relation to the specified tone level(s).2 | Average Control ± 25% below 500 Hz ± 50% above 500 Hz | Maxi Control +10% / -25% below 500 Hz +10% / -50% above 500Hz |
| Cross-axis Motion: Tone levels measured along the mutually orthogonal directions, in relation to the in-axis specified level(s). | Less than 50% below 500 Hz Less than 100% above 500 Hz Less than the relevant specified levels for the given cross-axis. | |
| Frequency sweep rate | ± 10% of stated rate | |
| Test time duration | ± 5% of stated duration | |
| Difference between the unfiltered signal and filtered acceleration signal3 | ± 5% on the grms values4 | |
1
- Composite Control is defined as: The Line Spectrum computed as either the average, maximum, or minimum (depending on control method) of all feedback channels deemed as control channels in a multi-point control scenario or the single control channel in a single-point control scenario. As discussed in paragraph 4.2.1.1
- 2 If using minimum control, the negative tolerance will be that of the Composite Control.
- 3 Distortion of the sinusoidal signal can occur particularly when using hydraulic actuators. If distortion of the sinusoidal signal is suspected, the unfiltered signal and filtered acceleration signal should be compared. A signal tolerance of ±5 percent corresponds to a distortion of 32 percent by utilization of the formula:
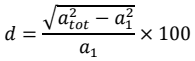
Figure description:
atot - a² d × 100 a1
where: a₁ = grms value of acceleration at the driving frequency;
atot total grms of the applied acceleration (including the value of α₁).
- 4 The grms of a sinusoid equals 0.707 times peak g. It is not related to grms of a random (g2/Hz) spectrum; do NOT use this to compare sine criteria (g) to random criteria (g2/Hz).
4.2.2.3 Frequency measurement
Ensure the vibration measurement system provides frequency measurements within ± 1.25 percent at the transducer mounting surface (or transducer target mounting surface) over the required frequency range.
4.2.2.4 Cross axis accelerations
In a single axis vibration test, cross axis vibration acceleration in two axes mutually orthogonal and orthogonal to the drive axis should be less than or equal to the values specified in Table 514.8-II for the cross axis of concern. If measured cross axis vibration accelerations exceed these values, the source of the vibration should be identified and addressed. The following common sources of cross axis vibration should be considered:
- a. Test fixture resonance. Prior to test, a test fixture survey should be conducted to ensure that the structural characteristics of the test fixture do not introduce uncontrollable resonances into the test setup. The survey may be experimental or analytical. If problematic resonances are identified, modifications should be made to the test fixture to shift the resonance beyond the frequency range of the test or to dampen the resonance in order to minimize the effect on the test.
- b. Test article resonance. Cross axis resonances of the test article may be characteristic of the test article structure and not necessarily a product of test fixture or restraint. As long as the test item is secured in a
manner consistent with the environment being tested, and the test fixture is not introducing unrealistic resonance, the following options should be considered in limiting the cross axis vibration:
- (1) Response Limit - A limit spectrum may be applied to the cross axis response of the test article in order to effectively notch the control spectrum in the drive axis. This limit spectrum should be defined in terms of the test profile for the cross axis of concern. For example, if the transverse response to vertical axis test is excessive, the transverse response should be limited to some factor of the corresponding transverse profile. In a random vibration test, the cross axis resonances are often narrow frequency bands, the notching may be within acceptable tolerances.
- (2) Multi-axis Test - If the test article structure is such that the cross axis vibration response to a single axis vibration test is beyond acceptable levels, it may be necessary to conduct the test as a multi-axis in order to simultaneously control multiple axes of vibration to the required test profiles. Method 527.1 discusses the technical details associated with multi-axis vibration testing.
4.2.3 Instrumentation
In general, acceleration will be the quantity measured to meet the vibration specification. On occasion, other devices may be employed, e.g., strain gage, linear displacement/voltage transducer, force gage, laser velocimeter, rate gyro, etc. In these cases, give special consideration to the instrument specification to satisfy the calibration, measurement, and analysis requirements. Calibrate all measurement instrumentation to traceable national calibration standards (see Part One, paragraph 5.3.2). The measurement device and its mounting will be compatible with the requirements and guidelines provided in paragraph 6.1, reference c.
- a. Accelerometer. In the selection of any transducer, one should be familiar with all parameters provided on the associated specification sheet. Key performance parameters for an accelerometer follow:
- (1) Frequency Response: A flat frequency response within ± 5 percent across the frequency range of interest is required.
- (2) Transverse sensitivity should be less than or equal to 5 percent.
- (3) Nearly all transducers are affected by high and low temperatures. Understand and compensate for temperature sensitivity deviation as required. Temperature sensitivity deviations at the test temperature of interest should be no more than ±5 percent relative to the temperature at which the transducer sensitivity was established.
- (4) Base Strain sensitivity should be evaluated in the selection of any accelerometer. Establishing limitations on base strain sensitivity is often case specific based upon the ratio of base strain to anticipated translational acceleration.
- b. Other measurement devices. Any other measurement devices used to collect data must be demonstrated to be consistent with the requirements of the test.
- c. Signal conditioning. Use only signal conditioning that is compatible with the instrumentation requirements of the test, and is compatible with the requirements and guidelines provided in paragraph 6.1, reference c. In particular, filtering of the analog voltage signals will be consistent with the time history response requirements (in general, demonstrable linearity of phase throughout the frequency domain of response), and the filtering will be so configured that anomalous acceleration data caused by clipping will not be misinterpreted as response data.
4.3 Test interruption
Test interruptions can result from multiple situations. The following paragraphs discuss common causes for test interruptions and recommended paths forward for each. Recommend test recording equipment remain active during any test interruption if the excitation equipment is in a powered state.
514.8-4.3 Installed Equipment Schedules
- a. Attach tri-axial accelerometers at the actual or proposed vehicle/installed equipment interface to measure input to the equipment as it will subsequently appear as a test item in the laboratory. Orient the accelerometers to measure data in the V, T, and L axes as described in paragraph 4.2 above.
- b. Insure that instrumentation is working properly and all transducers are calibrated.
- c. Operate the vehicle at the prescribed speed(s) over the designated fixed profile courses, and record the data.
4.3.1 Interruption due to laboratory equipment malfunction
- a. General. See Part One, paragraph 5.11, of this Standard.
- b. Specific to this Method. When interruptions are due to failure of the laboratory equipment, analyze the failure to determine root cause. It is also strongly advised that both control and response data be evaluated
to ensure that no undesired transients were imparted to the test item during the test equipment failure. If the test item was not subjected to an over-test condition as a result of the equipment failure, repair the test equipment or move to alternate test equipment and resume testing from the point of interruption. If the test item was subjected to an over-test condition as a result of the equipment failure, the test engineer or program engineer responsible for the test article should be notified immediately. A risk assessment based on factors such as level and duration of the over-test event, spectral content of the event, cost and availability of test resources, and analysis of test specific issues should be conducted to establish the path forward. See Annex A, paragraph 2.1 for descriptions of common test types and a general discussion of test objectives.
4.3.2 Interruption due to test item operation failure
Failure of the test item(s) to function as required during operational checks presents a situation with several possible options. Failure of subsystems often has varying degrees of importance in evaluation of the test item. Selection of option a through c below will be test specific.
- a. The preferable option is to replace the test item with a “new” one and restart the entire test.
- b. An alternative is to replace / repair the failed or non-functioning component or assembly with one that functions as intended, and restart the entire test. A risk analysis should be conducted prior to proceeding since this option places an over-test condition on the entire test item except for the replaced component. If the non-functioning component or subsystem is a line replaceable unit (LRU) whose life-cycle is less than that of the system test being conducted, proceed as would be done in the field by substituting the LRU, and continue from the point of interruption.
- c. For many system level tests involving either very expensive or unique test items, it may not be possible to acquire additional hardware for re-test based on a single subsystem failure. For such cases, a risk assessment should be performed by the organization responsible for the system under test to determine if replacement of the failed subsystem and resumption of the test is an acceptable option. If such approval is provided, the failed component should be re-tested at the subcomponent level.
NOTE: When evaluating failure interruption, consider prior testing on the same test item and consequences of such.
4.3.3 Interruption due to a scheduled event
There are often situations in which scheduled test interruptions will take place. For example, in a tactical transportation scenario, the payload may be re-secured to the transport vehicle periodically (i.e., tie-down straps may be re-secured at the beginning of each day). Endurance testing often represents a lifetime of exposure; therefore it is not realistic to expect the payload to go through the entire test sequence without re-securing the tie-downs as is done in a tactical deployment. Similarly, items mounted on rubber isolation systems may require monitoring of the isolator temperature with planned test interruptions to prevent overheating and unnatural failure of the isolator. Many other such interruptions, to include scheduled maintenance events, are often required over the life-cycle of materiel. Given the cumulative nature of fatigue imparted by dynamic testing, it is acceptable to have test interruptions that are correlated to realistic life-cycle events. All scheduled interruptions should be documented in the test plan and test report.
4.3.4 Interruption due to exceeding test tolerances
Exceeding the test tolerances defined in paragraph 4.2.2, or a noticeable change in dynamic response may result in a manual operator initiated test interruption or an automatic interruption when the tolerances are integrated into the control strategy. In such cases, the test item, fixturing, and instrumentation should be checked to isolate the cause.
- a. If the interruption resulted from a fixturing or instrumentation issue, review the data leading up to the test interruption and assess the extent of over/under test, if any. If an over/under test condition is identified, document the incident and obtain approval from the organization responsible for the system under test to correct the problem and resume the test.
MIL-STD-810H
METHOD 514.8
- b. If the interruption resulted from a structural or mechanical degradation of the test item, the problem will generally result in a test failure and requirement to re-test unless the problem is allowed to be corrected during testing by the organization responsible for the system under test. If the test item does not operate satisfactorily, see paragraph 5 for failure analysis, and follow the guidance in paragraph 4.3.2 for test item failure.
4.4 Test Setup
See Part One, paragraph 5.8. For standardization purposes, major axes are defined as vertical (perpendicular to level ground); longitudinal (parallel to vehicle fore and aft movement), and transverse (perpendicular to vertical and longitudinal movement).
4.4.1 Procedure I - General vibration
- a. Test Configuration. Configure the test item appropriately for the life cycle phase to be simulated.
- i. Transportation. Configure the test item for shipment including protective cases, devices, and/or packing. Mount the test item to the test fixture(s) by means of restraints and/or tie downs dynamically representative of life cycle transportation events.
- ii. Operational service. Configure the test item for service use. Secure the test item to the test fixture(s) at the mounting point(s) and use the same type of mounting hardware as used during life cycle operational service. Provide all mechanical, electrical, hydraulic, pneumatic or other connections to the materiel that will be used in operational service. Ensure these connections dynamically simulate the service connections and that they are fully functional unless otherwise specified.
- b. Instrumentation. Installation and location of the control accelerometer(s) can significantly affect test outcome. It is recommended to mechanically attach (i.e., screw mount) control accelerometer(s) to the vibration test fixture near the test item interface(s) or at the location(s) used to derive the test specification. Additional control and/or response instrumentation may be attached with screws or adhesives to other locations on the vibration table or test item as specified in the test plan. All instrumentation locations should be described in the test plan and in the specification derivation report. Examples are presented in Annex C.
4.4.2 Procedure II - Loose cargo transportation
The loose cargo test can be considered as being of two types that differ from one another only in the installation conditions of the materiel. Two different setups of fencing are required depending on the type of test item. The two types are those that are more likely to slide on the test surface or “rectangular cross section items” (typically packaged items), and those most likely to roll on the surface or “circular cross section items.” See paragraph 4.5.3 for details of the test procedure. Fencing information is presented in Annex C, paragraph 2.2. Because part of the damage incurred during testing of these items is due to the items impacting each other, the number of test items should be greater than three where the size of the item is such that more than three items in a typical cargo truck bed. Although the loose cargo transportation simulators are typically operated at fixed rates of rotation, it is recommended to monitor and record an accelerometer on the table surface in order to (1) provide measurable verification of the table motion and (2) detect any change in the test setup caused by degradation of the fencing or damage to the test article.
4.4.3 Procedure III - Large assembly transport
Install the test item in/on the vehicle in its intended transport or service configuration. If the test assembly is to be contained within a shelter, or if other units are attached to the materiel assembly in its in-service configuration, also install these items in their design configuration.
- a. Test surfaces. When setting up the test, consider the test surfaces available at the particular test location (see paragraph 6.1, reference b). Also, ensure the selection of test surfaces, test distances, and test speeds are appropriate for the specified vehicles and their anticipated use as defined in the vehicle OMS/MP.
- b. Test loads. Response of the vehicle to the test terrain is a function of the total load and the distribution of the load on the vehicle. In general, a harsher ride occurs with a lighter load, while a heavier load will result
in maximum levels at lower frequencies. Multiple test runs with variations in load may be required to include worst case, average, or other relevant cases.
- c. Tie-down/mounting arrangements. During the test, it is important to reproduce the more adverse arrangements that could arise in normal use. For example, during transportation, relaxation of tie-down strap tension could allow the cargo to lift off the cargo bed and result in repeated shock conditions. Excessive tightening of webbing straps could prevent movement of test items and thereby reduce or eliminate such shocks.
4.4.4 Procedure IV - Assembled aircraft store captive carriage and free flight
- a. Captive carriage test fixture. Suspend the test item (store) from a structural support frame by means of the operational service store suspension equipment (bomb rack, launcher, pylon, etc.). Ensure the flexible modes of the support frame are as high as practical, at least twice the first flexible frequency of the store, and that they do not coincide with store modes. Include and load (torque, clamp, latch, etc.) sway braces, lugs, hooks or other locking and load carrying devices that attach the store to the suspension equipment and the suspension equipment to the carrier aircraft, as required for captive carriage in service. Ensure the layout of the structural support frame and the test area is such that there is adequate access for the vibration exciters and test materiel.
- (1) Configure the assembled store for captive carriage and mount it to the structural support frame. Softly suspend the structural support frame within the test chamber. Ensure that rigid body modes of the store, suspension equipment, and structural support frame combination are between 5 and 20 Hz, and lower than one half the lowest flexible mode frequency of the store. Use structural support that is sufficiently heavy and of sufficient pitch and roll inertias to approximately simulate carrier aircraft dynamic reaction mass. If the structural support is too heavy or its inertia too large, the store suspension equipment and store hardback will be over-stressed. This is because unrealistically high dynamic bending moments are needed to match acceleration spectral densities. Conversely, if the structural support is too light or its inertia too low, there will be an undertest of the suspension equipment and store hardback.
- (2) Do not use the structural support to introduce vibration into the store. Hard-mounting stores to large shakers has proven to be inadequate. Test experience with F-15, F-16, and F/A-18 stores indicates that including a structural support/reaction mass greatly improves the match between flight measured data and laboratory vibrations, particularly at lower frequencies.
- (3) In cases in which the frequency requirements in (1) and (2) cannot be met, consider force control strategy (see paragraph 4.2.1.2).
- b. Free flight test fixture. Configure the assembled test store for free flight and softly suspend it within the test chamber. Ensure rigid body modes of the suspended store are between 5 and 20 Hz and lower than one half the lowest flexible mode frequency of the store.
- c. Orientation. With the store suspended for test, the longitudinal axis is the axis parallel to the ground plane and passing through the longest dimension of the store. The vertical axis is mutually perpendicular to the ground plane and the longitudinal axis. The transverse axis is mutually perpendicular to longitudinal and vertical axes.
- d. Vibration excitation. Store longitudinal vibration is typically less than vertical and transverse vibration. Vertical and transverse excitation of store modes usually results in sufficient longitudinal vibration. When a store is relatively slender (length greater than 4 times the height or width), drive the store in the vertical and transverse axes. In other cases, drive the store in the vertical, transverse, and longitudinal axes. If a store contains material that is not vibration tested except at assembled store level, or the store contains components that are sensitive to longitudinal vibration, include longitudinal excitation.
- (1) Transmit vibration to the store by means of rods (stingers) or other suitable devices running from vibration exciters to the store. Separate drive points at each end of the store in each axis are recommended. Ideally, the store will be driven simultaneously at each end. However, it can be driven at each end separately. A single driving point in each axis aligned with the store aerodynamic center
has also been successful. Use drive points on the store surfaces that are relatively hard and structurally supported by the store internal structure or by test fixture(s) (usually external rings around the local store diameter) that distribute the vibratory loads into the store primary structure.
- (2) There are many signal forms available to drive the vibration exciters. Some of the most popular are uncorrelated random, sinusoidal and transient (burst random or sine) excitation. Consideration of the characteristics of the store structure, the suspension equipment, general measurement considerations, and the desired data resolution will dictate selection of the driving signals. Uncorrelated random excitation and burst random excitation should be accomplished such that the signals are driven periodically within each data acquisition block in order to improve the data quality of the derived frequency response functions (FRFs). Use of more than one vibration exciter with random excitation will assist in minimizing the influence of non-linear behavior and allows the structure to be uniformly excited and allow for better FRFs. In turn, sinusoidal excitation should be used to characterize non- linearities in the system. For suspension systems involving carriage of multiple stores, the relative phase characteristics between stores should be defined and efforts made to replicate relative phasing in the laboratory setting to the maximum degree possible. It is acknowledged that there may not be sufficient excitation degrees-of-freedom to have full control authority over the phase characteristics of multiple stores. When more than one vibration exciter is used simultaneously, knowledge of multiple exciter testing techniques that include specification of the vibration exciter cross-spectral density matrices is required (reference Method 527.1). The auto and cross-spectral density characteristics should be made available as part of the test specification. In the absence of measured cross-spectral data, the cross-spectrum will need to be either estimated via model, or assumed to be uncorrelated. Additional information regarding specification of cross-spectral parameters is addressed in paragraph 6.1, reference gg. For the case in which the cross-spectral density between drive points is assumed to be zero, recognize that due to coupling between the vibration exciters via the store/suspension structure, some level of correlation between the control points will generally exist.
- e. Instrumentation. Mount transducers on the store and/or the store excitation devices to monitor compliance of vibration levels with requirements, to provide feedback signals to control the vibration exciter, and to measure materiel function. Additionally, it is usually important to overall program objectives to add transducers to measure the local vibration environment throughout the store. Note the vibration exciter control strategy used, e.g., single point response, multipoint response, force limit, waveform, etc. Also note the relationship between field measurement data and laboratory measurement data.
- (1) Mount accelerometers to monitor vibration levels at the forward and aft extremes of the primary load carrying structure of the store. Do not mount these accelerometers on fairings, unsupported areas of skin panels, aerodynamic surfaces, or other relatively soft structures. In some cases (see paragraph 4.4.4c above), transducers are required in the vertical and transverse directions. In other cases, transducers are required in vertical, transverse, and longitudinal directions. Designate these transducers as the test monitor transducers.
- (2) An alternate method is to monitor the test with strain gages that are calibrated to provide dynamic bending moment. This has proven successful where integrity of the store primary structure is a major concern. Flight measured dynamic bending moment data is required for this Method. Also, use accelerometers positioned as discussed above to verify that general vibration levels are as required.
- (3) As feedback control transducers, use either accelerometers on or near the store/vibration transmission device(s)/vibration exciter interface, force transducer(s) in series with the store/vibration transmission device(s)/vibration exciter, or dynamic bending moment strain gages. A clear understanding of the vibration exciter control strategy and its effects on the overall measurements is necessary.
4.5 Test Execution
The following steps, alone or in combination, provide the basis for collecting necessary information concerning the durability and function of a test item in a vibration environment.
MIL-STD-810H
METHOD 514.8
4.5.1 Preparation for test
4.5.1.1 Preliminary steps
Before starting a test, review pretest information in the test plan to determine test details (procedure(s), test item configuration(s), levels, durations, vibration exciter control strategy, failure criteria, item operational requirements, instrumentation requirements, facility capability, fixture(s), etc.).
- a. Select appropriate vibration exciters and fixtures.
- b. Select appropriate data acquisition system (e.g., instrumentation, cables, signal conditioning, recording, analysis equipment).
- c. Operate vibration equipment without the test item installed to confirm proper operation.
- d. Ensure the data acquisition system functions as required.
4.5.1.2 Pretest standard ambient checkout
All items require a pretest standard ambient checkout to provide baseline data. Conduct the pretest checkout as follows:
- Step 1. Examine the test item for physical defects, etc. and document the results.
- Step 2. Prepare the test item for test, in its operating configuration if required, as specified in the test plan.
- Step 3. Examine the test item/fixture/exciter combination for compliance with test item and test plan requirements.
- Step 4. If applicable, conduct an operational checkout in accordance with the test plan and document the results for comparison with data taken during or after the test. If the test item does not operate as required, resolve the problems and repeat this step.
4.5.2 Procedure I - General vibration
-
Step 1. Conduct a fixture modal survey or resonance search, if required, and verify that fixture design is compliant with recommended practices, and meets any test defined requirements that may have been provided in the item-specific test plan (see paragraph 6.1, references aa, dd, and ee).
-
Step 2. Mount the test item to the test fixture in a manner dynamically representative of the life cycle event simulated.
-
Step 3. Install sufficient transducers on or near the test item/fixture/vibration exciter combination to measure vibration at the test item/fixture interface, to control the vibration exciter as required by the control strategy, and measure any other required parameters. Mount control transducer(s) as close as possible to the test item/fixture interface. Ensure that the total accuracy of the instrumentation system is sufficient to verify that vibration levels are within the tolerances of paragraph 4.2.2, and to meet additionally specified accuracy requirements.
-
Step 4. Conduct a test item modal survey or resonance search, if required.
-
Step 5. Perform a visual inspection of the test setup.
-
Step 6. Apply low level vibration to the test item/fixture interface. If required, include other environmental stresses.
-
Step 7. Verify that the vibration exciter, fixture, and instrumentation system function as required.
-
Step 8. Apply the required vibration levels to the test item/fixture interface. Apply additional environmental stresses as required.
-
Step 9. Monitor vibration levels and, if applicable, test item performance continuously through the exposure. If levels shift or a failure occurs, shut down the test in accordance with the test interruption procedure (paragraph 4.3.2). Determine the reason for the shift and proceed in accordance with the test interruption recovery procedure (paragraph 4.3.2).
-
Step 10. When the required duration has been achieved, stop the vibration.
-
Step 11. If the test plan calls for additional exposures, repeat Steps 5 through 10 as required by the test plan before proceeding.
-
Step 12. Inspect the test item, fixture, vibration exciter, and instrumentation. If failure, wear, looseness, or other anomalies are found, proceed in accordance with the test interruption recovery procedure (paragraph 4.3.2).
-
Step 13. Verify that the instrumentation functions as required, and perform an operational check of the test item as required per the test plan. If the test item fails to operate as intended, follow the guidance in paragraph 4.3.2 for test item failure.
Step 14. Repeat Steps 1 through 13 for each required excitation axis.
- Step 15. Remove the test item from the fixture and inspect the test item, mounting hardware, packaging, etc., for any signs of visual mechanical degradation that may have occurred during testing. See paragraph 5 for analysis of results.
4.5.3 Procedure II - Loose cargo transportation
- Step 1. Place the test item(s) on the package tester within the restraining fences in accordance with paragraph 2.2 of Annex C.
- Step 2. Install instrumentation to measure the rotational speed of the package tester. Ensure the total accuracy of the instrumentation system is sufficient to meet specified accuracy requirements.
- Step 3. After determining the number of possible test item orientations and corresponding test time (paragraph 3.1d), operate the package tester for the prescribed orientation duration (Annex C, paragraph 2.2).
- Step 4. Perform a visual inspection of the test item and an operational check. If the test item fails to operate as intended, follow the guidance in paragraph 4.3.2 for test item failure. Otherwise, proceed to Step 5.
- Step 5. Reorient the test item(s) and/or the fencing/impact walls in accordance with paragraph 3.1d(1) and Annex C, paragraph 2.2b.
Step 6. Operate the package tester for the next prescribed duration.
Step 7. Perform a visual inspection of the test item and an operational check. If the test item fails to operate as intended, see paragraph 5 for analysis of results, and follow the guidance in paragraph 4.3.2 for test item failure.
Step 8. Repeat Steps 5-7 for the total number of orientations.
- Step 9. Perform a final visual inspection of the test item and an operational check. See paragraph 5 for analysis of results.
4.5.4 Procedure III - Large assembly transport
Step 1. Mount the test item(s) on/in the test vehicle as required in the test plan.
- Step 2. If required, install transducers on or near the test item sufficient to measure vibration at the test item/vehicle interface, and to measure any other required parameters. Protect transducers to prevent contact with surfaces other than the mounting surface.
- Step 3. Subject the vehicle containing the test item to the specified test conditions in Annex C, paragraph 2.3, or as otherwise specified in the test plan.
- Step 4. Perform a visual inspection of the test item and an operational check. If the test item fails to operate as intended, follow the guidance in paragraph 4.3.2 for test item failure.
- Step 5. Repeat Steps 1 through 4 for additional test runs, test loads, or test vehicles as required by the test plan.
MIL-STD-810H
METHOD 514.8
Step 6. Perform a final visual inspection of the test item and an operational check. See paragraph 5 for analysis of results.
4.5.5 Procedure IV - Assembled aircraft store captive carriage and free flight
Step 1. With the store suspended within the test chamber and the instrumentation functional, verify that the store suspension system functions as required by measuring the suspension frequencies.
Step 2. If required, conduct a test item modal survey.
Step 3. If required, place the test item in an operational mode and verify that it functions properly. Perform a visual inspection of the test setup.
Step 4. Apply low level vibration to the vibration exciter/store interface(s) to ensure the vibration exciter and instrumentation system function properly. For acceleration feedback control, use an initial input level 12 dB down from the required forward test monitor transducer spectrum. For force feedback control, use a flat force spectrum where the response at the test monitor accelerometer is at least 12 dB below the required test monitor value at all frequencies. For bending moment feedback control, use an initial input level that is 12 dB down from the required test monitor transducer spectrum.
Step 5. Adjust the vibration exciter(s) such that the test monitor transducers in the excitation axis meet the test requirements. For acceleration control, identify the test monitor transducer spectrum peaks that exceed the input spectrum by 6 dB or more (frequencies may differ fore and aft). For force feedback control, identify major peaks from the force measurements to check monitor accelerometer transfer functions. For both cases, equalize the input spectra until the identified peaks equal or exceed the required test levels. The identified peaks shall include at least the first 3 structural elastic modes of the store airframe, any local mode frequencies for subsystem structure of significant mass, and any frequencies which correspond with subassembly local modes which are critical for store performance. Additionally, the input spectra should be equalized at all frequencies up to the first flexible bending mode peak of the store to achieve the required test levels for ensuring the aircraft suspension equipment / store interface is adequately stressed. The resulting input spectra should be as smooth and continuous as possible while achieving the required peak responses. (It is not necessary to fill in valleys in the test monitor transducer spectra; however, it is not acceptable to notch out the input in these valleys.) For bending moment control raise and shape the input spectrum until it matches the required spectrum (peaks and valleys).
Step 6. When the input vibration is adjusted such that the required input response (R1) is achieved, measure the off-axis response(s) (R2, R3). Verify that off-axis response levels are within requirements using the following equations. If the result obtained from the equation is greater than the value established for the equation, reduce the input vibration level until the achieved input and off-axis response levels are less than or equal to the appropriate constant. Apply these equations at each peak separately. Use the first equation for testing that requires vibration application in two separate mutually perpendicular axes, and use the second equation for testing that requires vibration application in three separate mutually perpendicular axes. Refer to paragraph 4.2.2.4 for additional guidance.
(R₁/A₁ + R₂/A₂) ≤2 or (R₁/A₁ + R₂/A₂ + R₃/A₃) ≤3
Where
Ri = Response level in g²/Hz or (N-m)²/Hz or (in-lb)²/Hz for i = 1 - 3, and Ai = Test requirement level in g²/Hz or (N-m)²/Hz or (in-lb)²/Hz for i = 1 - 3
For example:
For example: For testing that requires vibration application in three, separate, mutually-perpendicular axes, and the vibration is being applied in the vertical axis, use the equation below as follows:
MIL-STD-810H
METHOD 514.8
Where:
R1 = Vertical axis response level
A1 = Vertical axis requirement level
R2 = Transverse axis response level
A2 = Transverse axis requirement level
R3 = Longitudinal axis response level
A3 = Longitudinal axis requirement level.
For vibration being applied in either the transverse or longitudinal axis, repeat the above process. (R₁/A₁ + R₂/A₂ + R₃/A₃) ≤ 3
- Step 7. Verify that vibration levels are as specified. If the exposure duration is 1/2 hour or less, accomplish this step immediately after full levels are first applied, and immediately before scheduled shut down. Otherwise, accomplish this step immediately after full levels are first applied, every half-hour thereafter, and immediately before scheduled shut down.
- Step 8. Monitor the vibration levels and test item performance continuously through the exposure. If levels shift, performance deviates beyond allowable limits, or failure occurs, shut down the test in accordance with the test shut down procedure (paragraph 4.3). Determine the reason for the anomaly and proceed in accordance with the test interruption recovery procedure (paragraph 4.3).
Step 9. When the required duration has been achieved, stop the vibration.
- Step 10. If the test plan calls for additional exposures, repeat Steps 3 through 9 as required by the test plan before proceeding.
- Step 11. Inspect the test item, fixture, vibration exciter, and instrumentation. If failure, wear, looseness or other anomalies are found, proceed in accordance with the test interruption recovery procedure (paragraph 4.3).
- Step 12. Verify that the instrumentation functions as required and perform an operational check of the test item for comparison with data collected in paragraph 4.5.1.2. If the test item fails to operate as intended, follow the guidance in paragraph 4.3.2 for test item failure.
Step 13. Repeat Steps 1 through 12 for each required excitation axis.
- Step 14. Remove the test item from the fixture and inspect the test item, mounting hardware, packaging, etc., for any signs of visual mechanical degradation that may have occurred during testing. See paragraph 5 for analysis of results.