517.3 PYROSHOCK CONTENTS
| Paragraph | Page | |
|---|---|---|
| 1. | SCOPE | 1 |
| 1.1 | PURPOSE | 1 |
| 1.2 | APPLICATION | 1 |
| 1.2.1 | PYROSHOCK | 1 |
| 1.2.2 | PYROSHOCK - MOMENTUM EXCHANGE | 2 |
| 1.2.3 | PYROSHOCK - PHYSICAL PHENOMENON | 2 |
| 1.2.4 | CLASSIFICATION OF PYROSHOCK ZONES | 2 |
| 1.3 | LIMITATIONS | 3 |
| 2. | TAILORING GUIDANCE | 3 |
| 2.1 | SELECTING THE PYROSHOCK METHOD | 3 |
| 2.1.1 | EFFECTS OF PYROSHOCK | 3 |
| 2.1.2 | SEQUENCE AMONG OTHER METHODS | 4 |
| 2.2 | SELECTING A PROCEDURE | 4 |
| 2.2.1 | PROCEDURE SELECTION CONSIDERATIONS | 4 |
| 2.2.2 | DIFFERENCE AMONG PROCEDURES | 5 |
| 2.3 | DETERMINE TEST LEVELS AND CONDITIONS | 5 |
| 2.3.1 | GENERAL CONSIDERATIONS - TERMINOLOGY | 5 |
| 2.3.2 | SINGLE PYROSHOCK EVENT MEASUREMENT SYSTEM CHARACTERIZATION AND BASIC PROCESSING | 11 |
| 2.3.3 | TEST CONDITIONS - SHOCK SPECTRUM TRANSIENT DURATION AND SCALING | 14 |
| 2.3.3.1 | PYROSHOCK SOURCE ENERGY SCALING (SES) | 14 |
| 2.3.3.2 | PYROSHOCK RESPONSE LOCATION DISTANCE SCALING (RLDS) | 14 |
| 2.3.3.3 | MEASURED DATA AVAILABLE FROM PYROSHOCK | 15 |
| 2.3.3.4 | MEASURED DATA NOT AVAILABLE FROM PYROSHOCK | 16 |
| 2.3.4 | TEST AXES, DURATION, AND NUMBER OF SHOCK EVENTS | 18 |
| 2.3.4.1 | GENERAL | 18 |
| 2.3.4.2 | PROCEDURE I - NEAR-FIELD WITH AN ACTUAL CONFIGURATION | 18 |
| 2.3.4.3 | PROCEDURE II - NEAR-FIELD WITH A SIMULATED CONFIGURATION | 18 |
| 2.3.4.4 | PROCEDURE III-MID-FIELD WITH A MECHANICAL TEST DEVICE | 19 |
| 2.3.4.5 | PROCEDURE IV - FAR-FIELD WITH A MECHANICAL TEST DEVICE | 19 |
| 2.3.4.6 | PROCEDURE V - FAR-FIELD WITH AN ELECTRODYNAMIC SHAKER | 19 |
| 2.4 | TEST ITEM CONFIGURATION | 19 |
| 3. | INFORMATION REQUIRED | 19 |
| 3.1 | PRETEST | 19 |
| 3.2 | DURING TEST | 20 |
| 3.3 | POST-TEST | 20 |
| 4. | TEST PROCESS | 20 |
| 4.1 | TEST FACILITY | 20 |
| 4.2 | CONTROLS | 21 |
| 4.2.1 | CALIBRATION | 21 |
| 4.2.2 | TOLERANCES | 21 |
MIL-STD-810H
METHOD 517.3
CONTENTS - Continued
| Paragraph | Page | |
|---|---|---|
| 4.2.2.1 | PROCEDURE I - NEAR-FIELD WITH AN ACTUAL CONFIGURATION AND PROCEDURE II - NEAR-FIELD WITH A SIMULATED CONFIGURATION | 21 |
| 4.2.2.2 | PROCEDURE III-MID-FIELD WITH A MECHANICAL TEST DEVICE | 21 |
| 4.2.2.3 | PROCEDURE IV - FAR-FIELD WITH A MECHANICAL TEST DEVICE | 22 |
| 4.2.2.4 | PROCEDURE V - FAR-FIELD WITH AN ELECTRODYNAMIC SHAKER | 22 |
| 4.2.3 | INSTRUMENTATION | 22 |
| 4.2.4 | DATA ANALYSIS | 24 |
| 4.3 | TEST INTERRUPTION | 24 |
| 4.3.1 | INTERRUPTION DUE TO LABORATORY EQUIPMENT MALFUNCTION | 24 |
| 4.3.2 | INTERRUPTION DUE TO TEST ITEM OPERATION FAILURE | 24 |
| 4.4 | TEST EXECUTION | 25 |
| 4.4.1 | PREPARATION FOR TEST | 25 |
| 4.4.1.1 | PRELIMINARY STEPS | 25 |
| 4.4.1.2 | PRETEST CHECKOUT | 25 |
| 4.4.2 | TEST PROCEDURES | 25 |
| 4.4.2.1 | PROCEDURE I - NEAR-FIELD WITH ACTUAL CONFIGURATION | 26 |
| 4.4.2.2 | PROCEDURE II - NEAR-FIELD WITH SIMULATED CONFIGURATION | 26 |
| 4.4.2.3 | PROCEDURE III- MID-FIELD USING MECHANICAL TEST DEVICE | 26 |
| 4.4.2.4 | PROCEDURE IV - FAR-FIELD USING MECHANICAL TEST DEVICE | 27 |
| 4.4.2.5 | PROCEDURE V-FAR-FIELD USING ELECTRODYNAMIC SHAKER | 28 |
| 5. | ANALYSIS OF RESULTS | 28 |
| 5.1 | PROCEDURE I - NEAR-FIELD WITH AN ACTUAL CONFIGURATION | 28 |
| 5.2 | PROCEDURE II - NEAR-FIELD WITH SIMULATED CONFIGURATION | 28 |
| 5.3 | PROCEDURE III - MID-FIELD USING MECHANICAL TEST DEVICE | 28 |
| 5.4 | PROCEDURE IV - FAR-FIELD USING MECHANICAL TEST DEVICE | 29 |
| 5.5 | PROCEDURE V - FAR-FIELD USING ELECTRODYNAMIC SHAKER | 29 |
| 6. | REFERENCE/RELATED DOCUMENTS | 29 |
| 6.1 | REFERENCED DOCUMENTS | 29 |
| 6.2 | RELATED DOCUMENTS | 30 |
FIGURES
| FIGURE 517.3-1 | FULL DURATION NEAR-FIELD, LASER PYROSHOCK TIME HISTORY (MEAN REMOVED, FILTERED AT 200 KHz). | 6 |
| FIGURE 517.3-2 | FULL DURATION NEAR-FIELD, LASER PYROSHOCK VELOCITY TIME HISTORY | 7 |
| FIGURE 517.3-3 | FULL DURATION NEAR-FIELD, ACCELEROMETER PYROSHOCK TIME HISTORY | 8 |
| FIGURE 517.3-4 | FULL DURATION NEAR-FIELD, ACCELEROMETER PYROSHOCK VELOCITY TIME HISTORY | 8 |
| FIGURE 517.3-5 | ACCELERATION MAXIMAX SRS FOR THE PYROSHOCK, PRE-PYROSHOCK, AND POST PYROSHOCK (LASER). | 9 |
| FIGURE 517.3-6 | MAXIMAX PSEUDO-VELOCITY RESPONSE SPECTRUM FOR THE PYROSHOCK (LASER) | 10 |
| FIGURE 517.3-7 | FILTER ATTENUATION (CONCEPTUAL, NOT FILTER SPECIFIC) | 12 |
| FIGURE 517.3-8 | ILLUSTRATION OF SAMPLING RATES AND OUT OF BAND "FOLD OVER” FREQUENCIES FOR DATA ACQUISITION SYSTEMS. | 13 |
| FIGURE 517.3-9 | EMPIRICAL SCALING RELATIONSHIP FOR SHOCK RESPONSE SPECTRUM AS A FUNCTION OF THE DISTANCE FROM THE PYROTECHNIC SOURCE | 15 |
| FIGURE 517.3-10 | SHOCK RESPONSE SPECTRA FOR VARIOUS POINT SOURCE PYROTECHNIC DEVICES | 17 |
| FIGURE 517.3-11 | SHOCK RESPONSE SPECTRUM VERSUS DISTANCE FROM PYROTECHNIC SOURCE | 17 |
| FIGURE 517.3-12 | PEAK PYROSHOCK RESPONSE VERSUS DISTANCE FROM PYROTECHNIC SOURCE | 18 |
MIL-STD-810H
METHOD 517.3
CONTENTS - Continued Paragraph
Page
METHOD
517.3 ANNEX A
GUIDELINES FOR ADDITIONAL PYROSHOCK TIME HISTORY VALIDATION AND PROCESSING
| 1. | INTRODUCTION | A-1 |
| 2. | ALIASED DATA | A-1 |
| 3. | SLEW RATE CONTAMINATED DATA | A-4 |
| 4. | ACCELEROMETER DATA WITH BASE STRAIN EFFECTS | A-9 |
ANNEX A FIGURES
| FIGURE 517.3A-1. | A NEAR-FIELD PYROSHOCK FOLLOWED BY TWO MECHANICAL SHOCK EVENTS | .A-2 |
| FIGURE 517.3A-2. | THE INTEGRAL OF THE ACCELERATION DATA IN FIGURE 517.3A-1 | A-2 |
| FIGURE 517.3A-3. | DISCRETE FOURIER TRANSFORM OF THE DATA IN FIGURE 517.3A-1 | A-3 |
| FIGURE 517.3A-4. | THE SHOCK RESPONSE SPECTRA OF THE ACCELERATION DATA IN FIGURE 517.3A-1 (Q=10). | .A-3 |
| FIGURE 517.3A-5. | A NEAR-FIELD PYROSHOCK ACCELERATION TIME HISTORY | .A-4 |
| FIGURE 517.3A-6. | THE INTEGRAL OF THE ACCELERATION DATA IN FIGURE 517.3A-5 | .A-5 |
| FIGURE 517.3A-7. | DISCRETE FOURIER TRANSFORM OF THE DATA IN FIGURE 517.3A-5 | .A-6 |
| FIGURE 517.3A-8. | SHOCK RESPONSE SPECTRUM OF THE ACCELERATION TIME HISTORY FIGURE 517.3A-5 (Q=10) | A-6 |
| FIGURE 517.3A-9. | TIME HISTORY OF WAVELET CORRECTION REMOVED FROM THE ACCELERATION TIME HISTORY IN FIGURE 517.3A-5 | .A-7 |
| FIGURE 517.3A-10. | SHOCK RESPONSE SPECTRUM COMPARISON FOR CORRUPTED ACCELERATION (FIGURE 517.3A-5) AND REMOVED WAVELET CORRECT (FIGURE 517.3A-9) (Q=10) | .A-7 |
| FIGURE 517.3A-11. | SHOCK RESPONSE SPECTRUM CALCULATED FOR THE WAVELET CORRECTED ACCELERATION TIME HISTORY (Q=10) | A-8 |
| FIGURE 517.3A-12. | A NEAR-FIELD PYROSHOCK ACCELERATION TIME HISTORY | .A-8 |
| FIGURE 517.3A-13. | THE INTEGRAL OF THE ACCELERATION DATA IN FIGURE 517.3A-12 | .A-9 |
| FIGURE 517.3A-14. | A NEAR-FIELD PYROSHOCK ACCELERATION TIME HISTORY | A-10 |
| FIGURE 517.3A-15. | THE INTEGRAL OF THE ACCELERATION DATA IN FIGURE 517.3A-14 | A-10 |
Downloaded from https://www.everyspec.com
MIL-STD-810H METHOD 517.3
(This page is intentionally blank.)
MIL-STD-810H METHOD 517.3
METHOD
517.3 PYROSHOCK
NOTE: Tailoring is essential. Select methods, procedures, and parameter levels based on the tailoring process described in Part One, paragraph 4.2.2, and Annex C. Apply the general guidelines for laboratory test methods described in Part One, paragraph 5 of this Standard.
517.3 ANNEX A METHOD 517.3, ANNEX A GUIDELINES FOR ADDITIONAL PYROSHOCK TIME HISTORY VALIDATION AND PROCESSING
517.3 ANNEX A
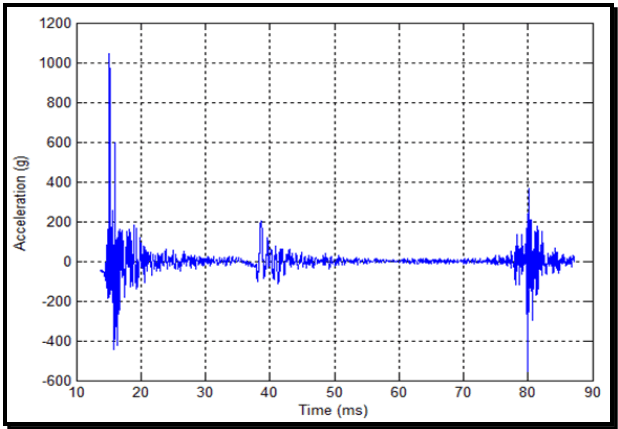
Figure description:
Acceleration vs Time
| Time (ms) | Acceleration (g) |
|---|---|
| 13.5 | -45 |
| 14.5 | -90 |
| 15.0 | 1050 |
| 15.3 | -180 |
| 15.8 | 600 |
| 16.2 | -440 |
| 17.5 | 160 |
| 18.5 | -150 |
| 20.0 | 50 |
| 25.0 | 15 |
| 30.0 | -10 |
| 35.0 | 5 |
| 38.0 | -100 |
| 38.8 | 200 |
| 40.0 | -100 |
| 41.5 | 110 |
| 42.5 | -110 |
| 50.0 | 0 |
| 60.0 | 0 |
| 70.0 | 0 |
| 78.5 | -120 |
| 79.5 | 140 |
| 80.1 | -600 |
| 80.3 | 410 |
| 81.0 | -280 |
| 81.5 | 210 |
| 82.5 | -180 |
| 84.0 | 50 |
| 87.0 | 0 |
Notes: The chart shows a signal with three distinct bursts of acceleration over time. The first burst occurs around 15 ms with a peak magnitude of over 1000g. A second, smaller burst occurs near 40 ms, and a third significant burst occurs around 80 ms, including the overall minimum acceleration value of approximately -600g.
Figure 517.3A-1. A near-field pyroshock followed by two mechanical shock events.
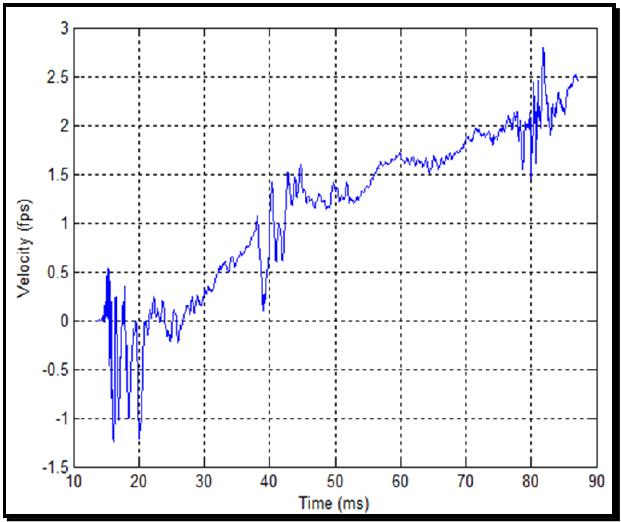
Figure description:
Velocity over Time
Velocity vs. Time
| Time (ms) | Velocity (fps) |
|---|---|
| 13.5 | 0.0 |
| 14.5 | 0.2 |
| 15.0 | 0.5 |
| 15.5 | -0.4 |
| 16.0 | -1.2 |
| 17.0 | -0.2 |
| 18.0 | -1.0 |
| 19.0 | -0.5 |
| 20.0 | -1.2 |
| 21.0 | -0.1 |
| 22.5 | 0.2 |
| 24.0 | 0.0 |
| 25.5 | -0.2 |
| 27.0 | 0.1 |
| 30.0 | 0.3 |
| 33.0 | 0.6 |
| 35.0 | 0.7 |
| 38.0 | 1.0 |
| 39.0 | 0.2 |
| 40.0 | 0.5 |
| 41.0 | 1.4 |
| 42.0 | 0.6 |
| 43.0 | 1.5 |
| 45.0 | 1.3 |
| 48.0 | 1.2 |
| 50.0 | 1.4 |
| 53.0 | 1.2 |
| 55.0 | 1.4 |
| 58.0 | 1.6 |
| 60.0 | 1.7 |
| 63.0 | 1.6 |
| 66.0 | 1.6 |
| 68.0 | 1.7 |
| 70.0 | 1.8 |
| 73.0 | 1.9 |
| 75.0 | 2.0 |
| 78.0 | 2.1 |
| 79.0 | 1.5 |
| 80.0 | 2.2 |
| 81.0 | 2.0 |
| 82.0 | 2.8 |
| 84.0 | 2.1 |
| 86.0 | 2.4 |
| 88.0 | 2.5 |
Notes: The data values are estimated based on the grid lines and axes provided in the image. The plot shows high-frequency noise or oscillation especially between 14-22 ms and 38-44 ms and 78-84 ms.
Figure 517.3A-2. The integral of the acceleration data in Figure 517.3A-1.
The discrete Fourier transform in Figure 517.3A-3 shows additional verification of the aliasing problem. An anti- aliasing filter with 60 dB/octave attenuation has 10 decade/decade slope on a log-log plot. Clearly the discrete Fourier transform in Figure 517.3A-3 does not have this attenuation and even starts to increase as it approaches the Nyquist frequency, an additional indication of aliasing. The positive and negative shock response spectra (SRS) are shown in Figure 517.3A-4.
MIL-STD-810H METHOD 517.3 ANNEX A
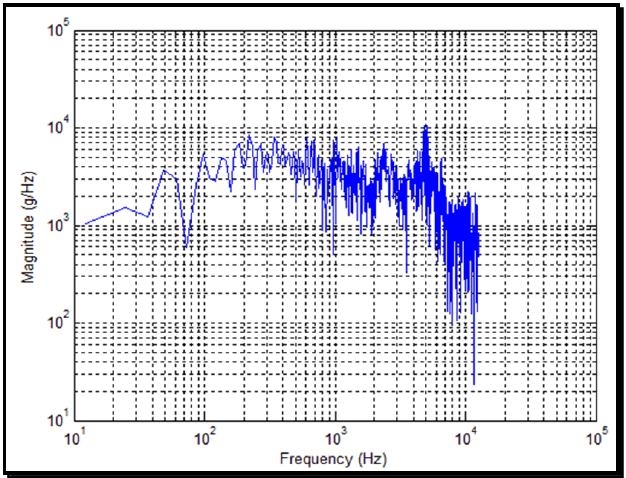
Figure description:
Magnitude (g/Hz vs Frequency (Hz
| Frequency (Hz) | Magnitude (g/Hz) |
|---|---|
| 10 | 1000 |
| 25 | 1500 |
| 40 | 1200 |
| 50 | 3500 |
| 70 | 600 |
| 100 | 5000 |
| 200 | 8500 |
| 400 | 6000 |
| 700 | 4000 |
| 1000 | 4500 |
| 2000 | 6500 |
| 4000 | 4000 |
| 5000 | 10000 |
| 8000 | 2000 |
| 10000 | 1500 |
| 11000 | 800 |
| 12000 | 2000 |
| 13000 | 25 |
Notes: The chart is a log-log plot showing a noisy signal representing Magnitude (g/Hz versus Frequency (Hz. The frequency axis ranges from 10^1 to 10^5 Hz, and the magnitude axis ranges from 10^1 to 10^5 g/Hz. The data series is represented by a single blue line. The values in the table are approximate representative points taken from the plot's logarithmic grid.))
Figure 517.3A-3. Discrete Fourier transform of the data in Figure 517.3A-1.
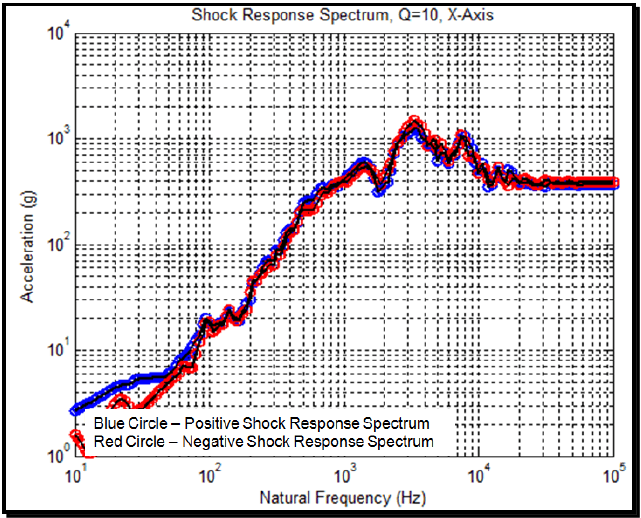
Figure description:
Shock Response Spectrum Q=10, X-Axis
Shock Response Spectrum, Q=10, X-Axis
Legend
- Positive Shock Response Spectrum — color: blue; symbol: Blue Circle
- Negative Shock Response Spectrum — color: red; symbol: Red Circle
| Natural Frequency (Hz) | Positive Shock Response Spectrum (g) | Negative Shock Response Spectrum (g) |
|---|---|---|
| 10 | 2.5 | 1.8 |
| 15 | 4.2 | 2.6 |
| 20 | 5.2 | 3.5 |
| 30 | 5.5 | 2.8 |
| 40 | 6.0 | 4.5 |
| 50 | 8.0 | 6.0 |
| 70 | 13 | 7.5 |
| 80 | 20 | 10 |
| 100 | 18 | 15 |
| 150 | 25 | 20 |
| 200 | 45 | 40 |
| 300 | 90 | 75 |
| 500 | 260 | 210 |
| 1000 | 580 | 520 |
| 1500 | 620 | 550 |
| 2000 | 380 | 450 |
| 3500 | 1500 | 1700 |
| 5000 | 950 | 850 |
| 7500 | 1200 | 1150 |
| 10000 | 650 | 550 |
| 15000 | 520 | 420 |
| 20000 | 450 | 430 |
| 30000 | 420 | 410 |
| 50000 | 400 | 400 |
| 100000 | 400 | 400 |
Notes: The chart is a log-log plot showing acceleration (g versus natural frequency (Hz. Both the positive and negative shock response spectrums converge to approximately 400g at frequencies above 20 kHz.))
Figure 517.3A-4. The shock response spectra of the acceleration data in Figure 517.3A-1 (Q=10).
These two SRS are plausible, especially if the SRS is not plotted below 100 Hz. Additionally, the positive and negative SRS show agreement that indicates good pyroshock data. In summary, the problems with these data are: inadequate sample rate, inadequate anti-aliasing filter, and inadequate zero time before and after the complex shock. The problems can be assessed by an inspection of the accelerometer and DAS specifications. However, these are problems that cannot be detected by examination of the acceleration time history and the SRS alone and emphasize the importance of integrating the acceleration time history as per paragraph 6.1, references b and d.
MIL-STD-810H METHOD
517.3 ANNEX A
517.3 ANNEX A
a high degree of confidence because the low-frequency asymptote is correct and the high-frequency content has been preserved. The positive and negative SRS in Figure 517.3A-11 show good agreement typical of a pyroshock or a pyroshock simulation. More details concerning the data analysis are in paragraph 6.1, reference q.
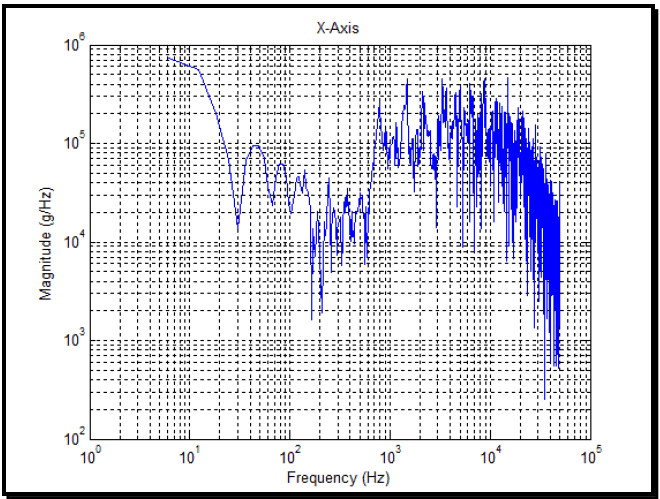
Figure description:
Spectral Analysis Magnitude
X-Axis
| Frequency (Hz) | Magnitude (g/Hz) |
|---|---|
| 6 | 720000 |
| 10 | 600000 |
| 15 | 250000 |
| 20 | 100000 |
| 30 | 15000 |
| 45 | 95000 |
| 60 | 40000 |
| 80 | 62000 |
| 100 | 25000 |
| 150 | 48000 |
| 180 | 1800 |
| 200 | 15000 |
| 300 | 25000 |
| 400 | 12000 |
| 600 | 28000 |
| 800 | 220000 |
| 1000 | 85000 |
| 1500 | 410000 |
| 2000 | 320000 |
| 3000 | 450000 |
| 5000 | 380000 |
| 8000 | 420000 |
| 10000 | 210000 |
| 15000 | 350000 |
| 20000 | 180000 |
| 30000 | 65000 |
| 40000 | 25000 |
| 50000 | 450 |
Notes: The chart is a log-log plot showing Magnitude (g/Hz versus Frequency (Hz. The data is highly variable at frequencies above 800 Hz, representing a complex spectrum. Data points in the markdown table are sampled approximations from the visual plot.))
Figure 517.3A-7. Discrete Fourier transform of the data in Figure 517.3A-5.
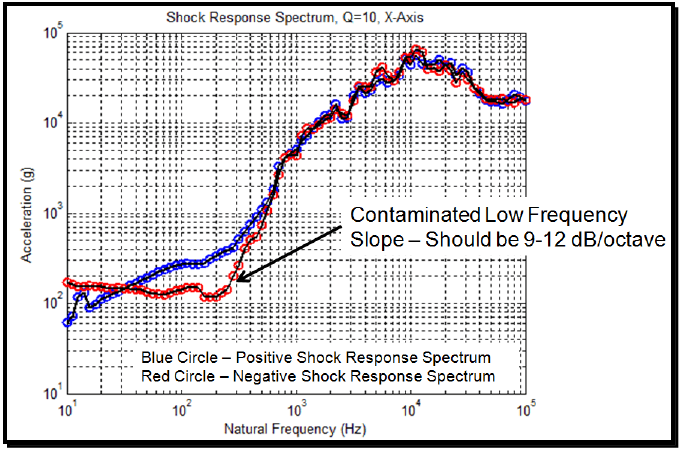
Figure description:
Shock Response Spectrum, Q=10, X-Axis
Shock Response Spectrum, Q=10, X-Axis
Legend
- Positive Shock Response Spectrum — color: blue; symbol: Blue Circle
- Negative Shock Response Spectrum — color: red; symbol: Red Circle
Annotations
- Contaminated Low Frequency Slope – Should be 9-12 dB/octave (text_label - position: Natural Frequency (Hz ≈ 300, Negative Shock Response Spectrum))
| Natural Frequency (Hz) | Positive Shock Response Spectrum (g) | Negative Shock Response Spectrum (g) |
|---|---|---|
| 10 | 60 | 180 |
| 12 | 80 | 160 |
| 15 | 100 | 160 |
| 20 | 130 | 160 |
| 30 | 160 | 160 |
| 40 | 190 | 150 |
| 60 | 230 | 140 |
| 80 | 260 | 130 |
| 100 | 280 | 160 |
| 150 | 350 | 120 |
| 200 | 450 | 120 |
| 250 | 600 | 220 |
| 300 | 800 | 450 |
| 400 | 1200 | 1000 |
| 500 | 2000 | 1800 |
| 600 | 3000 | 2800 |
| 800 | 5000 | 4500 |
| 1000 | 7500 | 7000 |
| 1500 | 11000 | 11000 |
| 2000 | 15000 | 13000 |
| 2500 | 21000 | 21000 |
| 3000 | 30000 | 28000 |
| 4000 | 35000 | 35000 |
| 5000 | 45000 | 40000 |
| 6000 | 35000 | 32000 |
| 7000 | 40000 | 45000 |
| 8000 | 55000 | 50000 |
| 10000 | 75000 | 65000 |
| 12000 | 55000 | 50000 |
| 15000 | 50000 | 45000 |
| 20000 | 45000 | 40000 |
| 25000 | 55000 | 50000 |
| 30000 | 40000 | 45000 |
| 40000 | 25000 | 25000 |
| 50000 | 20000 | 20000 |
| 60000 | 18000 | 18000 |
| 80000 | 20000 | 20000 |
| 100000 | 18000 | 18000 |
Notes: The chart represents a Shock Response Spectrum with a quality factor (Q of 10 for the X-axis. Both the Natural Frequency (Hz on the x-axis and the Acceleration (g on the y-axis are plotted on logarithmic scales. An annotation points to an area of the negative spectrum that may be contaminated by low-frequency noise.)))
Figure 517.3A-8. Shock response spectrum of the acceleration time history in Figure 517.3A-5 (Q=10).
MIL-STD-810H METHOD 517.3 ANNEX A
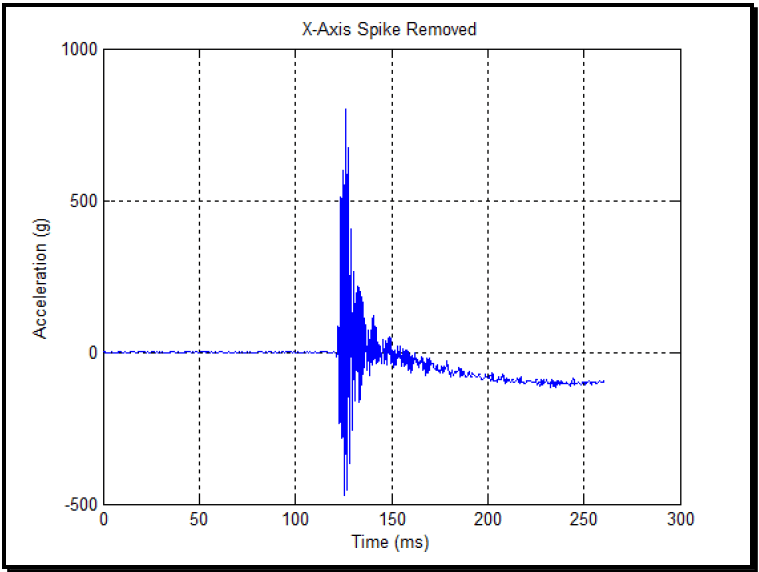
Figure description:
X-Axis Spike Removed
X-Axis Spike Removed
| Time (ms) | Acceleration (g) |
|---|---|
| 0 | 0 |
| 25 | 0 |
| 50 | 0 |
| 75 | 0 |
| 100 | 0 |
| 110 | 0 |
| 115 | 0 |
| 120 | 0 |
| 121 | 100 |
| 123 | 550 |
| 125 | 800 |
| 126 | -480 |
| 128 | 680 |
| 130 | 100 |
| 132 | 210 |
| 135 | 230 |
| 140 | 180 |
| 145 | 90 |
| 150 | 30 |
| 160 | -10 |
| 170 | -35 |
| 180 | -60 |
| 190 | -75 |
| 200 | -85 |
| 225 | -95 |
| 250 | -105 |
| 260 | -100 |
Notes: The plot shows an acceleration event occurring around 122ms. There is a sharp spike reaching approximately 800g and dropping to nearly -500g, followed by high-frequency oscillations that decay into a steady-state value of roughly -100g by 250ms.
Figure 517.3A-9. Time history of wavelet correction removed from the acceleration time history in Figure 517.3A-5.
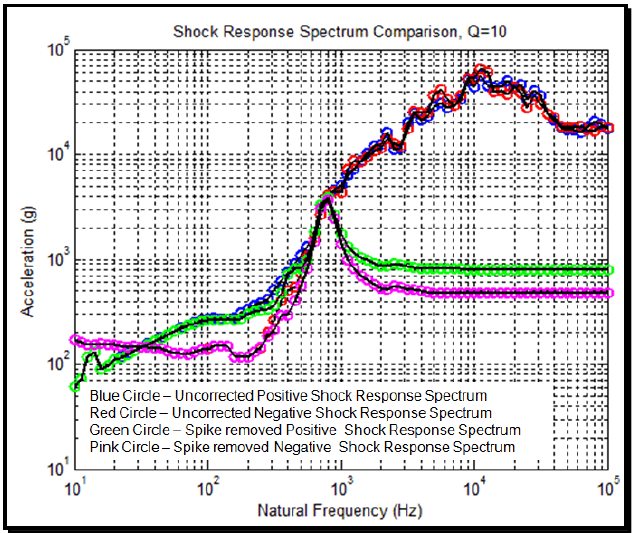
Figure description:
Shock Response Spectrum Comparison, Q=10
Shock Response Spectrum Comparison, Q=10
Legend
- Uncorrected Positive Shock Response Spectrum — color: blue; symbol: Blue Circle
- Uncorrected Negative Shock Response Spectrum — color: red; symbol: Red Circle
- Spike removed Positive Shock Response Spectrum — color: green; symbol: Green Circle
- Spike removed Negative Shock Response Spectrum — color: pink; symbol: Pink Circle
| Natural Frequency (Hz) | Uncorrected Positive (g) | Uncorrected Negative (g) | Spike removed Positive (g) | Spike removed Negative (g) |
|---|---|---|---|---|
| 10 | 70 | 70 | 60 | 180 |
| 20 | 120 | 110 | 110 | 150 |
| 50 | 180 | 180 | 180 | 160 |
| 100 | 250 | 250 | 250 | 250 |
| 200 | 380 | 350 | 380 | 130 |
| 300 | 450 | 400 | 450 | 200 |
| 400 | 750 | 650 | 750 | 550 |
| 500 | 1000 | 850 | 1000 | 1200 |
| 700 | 3500 | 3500 | 3500 | 3500 |
| 1000 | 5000 | 5000 | 1500 | 1300 |
| 1500 | 10000 | 9000 | 1100 | 800 |
| 2000 | 12000 | 11000 | 1000 | 600 |
| 3000 | 20000 | 18000 | 950 | 550 |
| 5000 | 30000 | 35000 | 900 | 500 |
| 10000 | 55000 | 60000 | 850 | 500 |
| 20000 | 45000 | 38000 | 850 | 500 |
| 50000 | 18000 | 18000 | 850 | 500 |
| 100000 | 18000 | 18000 | 850 | 500 |
Notes: The chart uses logarithmic scales for both axes. 'g' refers to the acceleration due to gravity.
Figure 517.3A-10. Shock response spectrum comparison for corrupted acceleration (Figure 517.3A-5) and removed wavelet correct (Figure 517.3A-9) (Q=10).
MIL-STD-810H METHOD 517.3 ANNEX A
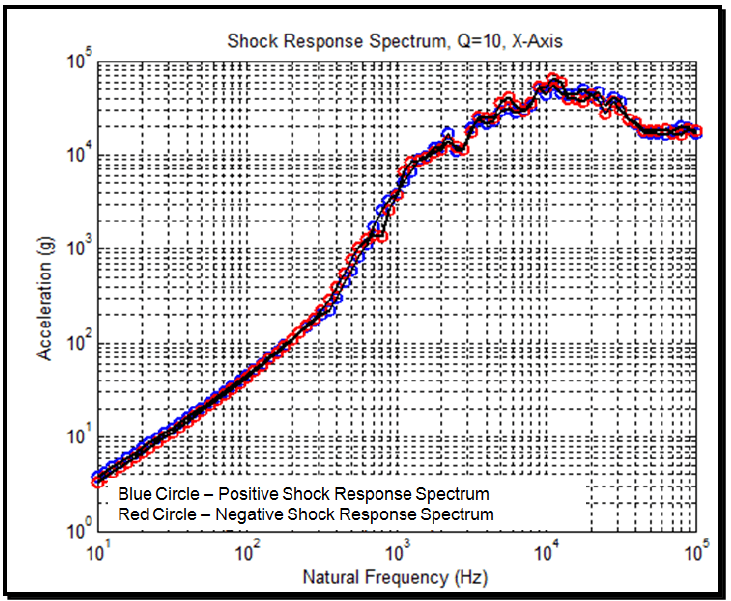
Figure description:
Shock Response Spectrum, Q=10, X-Axis
Shock Response Spectrum, Q=10, X-Axis
Legend
- Positive Shock Response Spectrum — color: blue; symbol: Circle
- Negative Shock Response Spectrum — color: red; symbol: Circle
| Natural Frequency (Hz) | Positive Shock Response Spectrum (g) | Negative Shock Response Spectrum (g) |
|---|---|---|
| 10 | 3.8 | 3.2 |
| 15 | 6.0 | 5.5 |
| 20 | 8.5 | 7.5 |
| 30 | 14.0 | 12.0 |
| 50 | 28.0 | 24.0 |
| 70 | 45.0 | 40.0 |
| 100 | 70.0 | 65.0 |
| 150 | 130.0 | 115.0 |
| 200 | 200.0 | 180.0 |
| 300 | 350.0 | 300.0 |
| 500 | 850.0 | 950.0 |
| 700 | 1500.0 | 1300.0 |
| 1000 | 4500.0 | 3800.0 |
| 1500 | 9000.0 | 8500.0 |
| 2000 | 17000.0 | 12000.0 |
| 3000 | 25000.0 | 22000.0 |
| 5000 | 42000.0 | 38000.0 |
| 7000 | 45000.0 | 48000.0 |
| 10000 | 55000.0 | 68000.0 |
| 15000 | 50000.0 | 45000.0 |
| 20000 | 40000.0 | 35000.0 |
| 30000 | 45000.0 | 40000.0 |
| 40000 | 30000.0 | 25000.0 |
| 50000 | 22000.0 | 24000.0 |
| 70000 | 19000.0 | 20000.0 |
| 100000 | 18000.0 | 18000.0 |
Notes: The chart is a log-log plot showing acceleration (g versus natural frequency (Hz. Q factor is 10 and data is for the X-Axis. Data points are estimated based on the logarithmic grid lines.))
Figure 517.3A-11. Shock response spectrum calculated for the wavelet corrected acceleration time history. (Q-10).
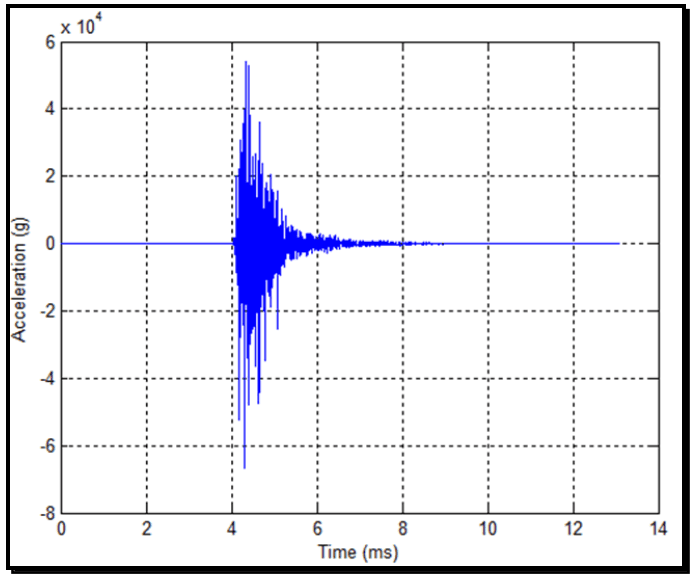
Figure description:
High-Frequency Acceleration Transient
Acceleration vs. Time
| Time (ms) | Acceleration (g) |
|---|---|
| 0.0 | 0 |
| 1.0 | 0 |
| 2.0 | 0 |
| 3.0 | 0 |
| 3.9 | 0 |
| 4.0 | 5000 |
| 4.1 | -35000 |
| 4.2 | 45000 |
| 4.3 | -68000 |
| 4.4 | 54000 |
| 4.5 | -45000 |
| 4.7 | 25000 |
| 5.0 | -18000 |
| 5.2 | 10000 |
| 5.5 | -5000 |
| 6.0 | 3000 |
| 7.0 | -1000 |
| 8.0 | 500 |
| 9.0 | 0 |
| 10.0 | 0 |
| 11.0 | 0 |
| 12.0 | 0 |
| 13.0 | 0 |
Notes: The y-axis units are scaled by 10^4 as indicated by the 'x 10^4' notation above the axis. The acceleration signal shows a high-frequency transient event starting at approximately 4.0 ms, reaching peak values of approximately 5.4 x 10^4 g and -6.8 x 10^4 g before decaying to near-zero by 8.0 ms.
Figure 517.3A-12. A near-field pyroshock acceleration time history.