505.7 SOLAR RADIATION (SUNSHINE) CONTENTS
| Paragraph | Page |
|---|---|
| 1. SCOPE | 1 |
| 1.1 PURPOSE. | 1 |
| 1.2 APPLICATION. | 1 |
| 1.3 LIMITATIONS. | 1 |
| 2. TAILORING GUIDANCE | 1 |
| 2.1 SELECTING This Method. | 1 |
| 2.1.1 EFFECTS OF SOLAR RADIATION ENVIRONMENTS | 1 |
| 2.1.1.1 HEATING EFFECTS. | 1 |
| 2.1.1.2 ACTINIC EFFECTS. | 2 |
| 2.1.2 SEQUENCE AMONG OTHER METHODS. | 2 |
| 2.2 SELECTING PROCEDURES | 2 |
| 2.2.1 PROCEDURE SELECTION CONSIDERATIONS | 2 |
| 2.2.2 DIFFERENCE BETWEEN PROCEDURES. | 3 |
| 2.3 DETERMINE TEST LEVELS AND CONDITIONS. | 6 |
| 2.3.1 CLIMATIC CONDITIONS | 6 |
| 2.3.2 TEST DURATION | 6 |
| 2.3.3 HUMIDITY | 6 |
| 2.3.4 CONFIGURATION | 7 |
| 2.3.5 SPECTRAL POWER DISTRIBUTION - SEA LEVEL VERSUS HIGH GROUND ELEVATIONS. | 7 |
| 2.3.6 TEMPERATURE | 7 |
| 2.3.7 AIRFLOW | 7 |
| 2.4 TEST ITEM OPERATION. | 8 |
| 3. INFORMATION REQUIRED | 8 |
| 3.1 PRETEST | 8 |
| 3.2 DURING TEST | 8 |
| 3.3 POST-TEST. | 9 |
| 4. TEST PROCESS | 9 |
| 4.1 TEST FACILITY | 9 |
| 4.1.1 SUBSTRATE | 9 |
| 4.1.2 SOLAR RADIATION SOURCE | 10 |
| 4.2 CONTROLS. | 11 |
| 4.3 TEST INTERRUPTION. | 12 |
| 4.3.1 INTERRUPTION DUE TO CHAMBER MALFUNCTION. | 12 |
| 4.3.2 INTERRUPTION DUE TO TEST ITEM OPERATION FAILURE | 13 |
| 4.4 TEST EXECUTION | 13 |
| 4.4.1 PREPARATION FOR TEST. | 13 |
| 4.4.1.1 PRELIMINARY STEPS | 13 |
| 4.4.1.2 PRETEST STANDARD AMBIENT CHECKOUT | 13 |
| 4.4.2 PROCEDURE I - CYCLING | 14 |
| 4.4.3 PROCEDURE II - STEADY STATE | 14 |
| 5. ANALYSIS OF RESULTS | 15 |
MIL-STD-810H METHOD
505.7 CONTENTS - Continued
| Paragraph | Page | |
|---|---|---|
| 6. | REFERENCE/RELATED DOCUMENTS. | 15 |
| 6.1 | REFERENCED DOCUMENTS.. | 15 |
| 6.2 | RELATED DOCUMENTS | 15 |
| TABLES | ||
| TABLE 505.7-I | SPECTRAL POWER DISTRIBUTION. | 7 |
| TABLE 505.7-II | TEST PARAMETER TOLERANCES | 12 |
| FIGURES | ||
| FIGURE 505.7-1 | PROCEDURE I - CYCLING TEST | 4 |
| FIGURE 505.7-2 | PROCEDURE II - STEADY STATE TEST | 5 |
METHOD 505.7, ANNEX A METHOD 890.1, ANNEX
505.7 ANNEX B INSTRUMENTATION INSTALLATION, PLACEMENT AND GUIDANCE INSTRUMENTATION
- a. Measurement of Irradiance. The type of instrument considered most suitable for measuring/monitoring the irradiance during test set up and test operation is the pyranometer. The pyranometer is designed for measuring the irradiance (radiant-flux, watts/m²) on a plane surface that results from direct solar radiation and from the diffuse radiation incident from the hemisphere above. ISO-9060 (paragraph 6.1, reference d), provides additional information regarding definitions, design criteria, and proper use.
- b. Pyranometer Classifications.
- (1) Referring to ISO-9060, the pyranometer used for testing should be critically selected based on the specific internal requirements for internal tractability/calibration certification, and the ability of the selected pyranometer to meet the requirements of the test and test process (see ISO 9060, Table 1 for classification details, paragraph 4.3.2, “Classification Criteria”).
- (2) In tests where a direct traceability chain is required, recommend a pyranometer meeting the classification of “secondary standard.” For typical test set-up and operation, a classification of “First Class Instrument” is generally sufficient. As a minimum, calibrate all instruments on an annual basis.
- c. Pyranometer Use Guidelines.
- (1) Pyranometers are used for validating irradiance values during test set-up, for pre-test, during the test, and post test to confirm the specified radiant energy values are maintained. Recommended the interval used for radiant energy level verification during a test be once per day, OR as required based on historical statistical charting showing test compliance for longer periods. For Procedure I, in addition to recording the pretest calibration, it is recommended to record the intensity level at a sufficient interval to verify the proper radiation intensity is achieved throughout the cycle. For Procedure II, in addition to recording the pretest calibration, it is recommended to record the intensity once per-cycle and verify the UVa and UVb portions of the spectrum every seventh cycle.
- (2) If pyranometers are continuously exposed to the solar radiation source, consider thermal drift of the radiant energy values provided by the pyranometer. Some pyranometers require a thermal offset value based on temperature, while others have internal offset characteristics that minimize thermal drift.
- (3) Periodic calibration certification of pyranometers is required, typically once per-year or as specified by the pyranometer manufacturer. The pyranometer calibration is to be certified in accordance to ISO-9847, paragraph 6.1, reference e, or ASTM E-824, paragraph 6.1, reference f.
- (4) Proper mounting, mounting location, and horizontal placement of the pyranometer are critical to achieving proper evaluation of the test item. The testing parties must agree to the mounting of the pyranometer for the test, with mounting location and method recorded as part of the permanent test record.
- d. Evaluation of Spectral Power Distribution (SPD). Measuring and monitoring spectral power distribution of the lamp demonstrates compliance with Table 505.7-I. Ensure the SPD measurement system is calibrated and operating properly for accuracy, especially in the ultraviolet range. Instrument accuracy can be found in Table 505.7B-I. Spectral power distribution evaluation guidelines:
- (1) SPD measurements are critical for simulated solar testing. The pre and post test results should be documented in the final test report.
- (2) Often SPD measurement devices are limited to a maximum range of 800 nm or 1100 nm, and the pyranometer reading is used to algebraically calculate the energy in the infrared range (780 nm-3000 nm).
MIL-STD-810H METHOD 505.7, ANNEX B
| Measurement Instrument | Parameter Measured | Tolerance |
|---|---|---|
| Pyranometer/Pyrheliometer | Total irradiation (direct and scattered) | Secondary Standard in accordance with ISO 9060 |
| Spectroradiometer or Filtered Pyranometer | Spectral distribution | ±4 percent over the specified radiometric band |
NOTE: A filtered pyranometer may not provide a satisfactory resolution in the ultraviolet range.
MIL-STD-810H
METHOD 505.7, ANNEX C METHOD 505.7 ANNEX C GUIDANCE ON TABLES AND FIGURES
The following is a copy of Table 505.7-I in the main body of this Method. Inserting it here facilitates discussion on its use in calculating points on the curve in Figure 505.7-1.
| Spectral Region | Bandwidth (nm) | Natural Radiation (% of total) | Tolerance (% of total) | Irradiance (W/m²) | Spectral Region Irradiance (W/m²) | ||
|---|---|---|---|---|---|---|---|
| Min | Max | ||||||
| Ultraviolet | - B | 280-320 | 0.5 | 0.3 | 0.7 | 5.6 | 5.6 |
| Ultraviolet - A | 320-360 | 2.4 | 1.8 | 3 | 26.9 | 62.7 | |
| 360-400 | 3.2 | 2.4 | 4.4 | 35.8 | |||
| Visible | 400-520 | 17.9 | 16.1 | 19.7 | 200.5 | 580.2 | |
| 520-640 | 16.6 | 14.9 | 18.3 | 185.9 | |||
| 640-800 | 17.3 | 12.8 | 19 | 193.8 | |||
| Infrared | 800-3000 | 42.1 | 33.7 | 50.5 | 471.5 | 471.5 | |
| Totals | 1120 | 1120 | |||||
Compliance to solar radiation requirements covers two main elements, providing the recommended spectral power distribution of the light source, and providing the correct irradiance levels over the specified surface of the test item.
The information in Table 505.7-I is used to determine the capability of the artificial light source to produce a satisfactory spectrum for use in solar simulation testing.
Table 505.7A-I provides guidance for on-sample test level simulated solar radiation intensity and uniformity target values.
Definition: Spectral Power Distribution: The relative power emitted by a source as a function of wavelength. (See paragraph 6.1, reference g.)
EXAMPLES
The following examples are to illustrate possible test configurations and instrument placement. As each test is performed to accomplish specific evaluations and address specific system performance criteria, these examples is for illustration only with actual test configuration to be performed according to the test plan and as agreed between the contractual parties.
- a. When setting up a solar radiation test the following steps can be employed:
- (1) Establish a ±10 percent uniformity value over an established test plane appropriate for the test item. A grid pattern appropriate for the size of the test item is established, and the solar radiation system is adjusted to provide a uniform exposure over the test plane. During this process, either multiple radiometers or a single radiometer is used and moved to positions required for solar radiation uniformity verification.
MIL-STD-810H
METHOD 505.7, ANNEX C
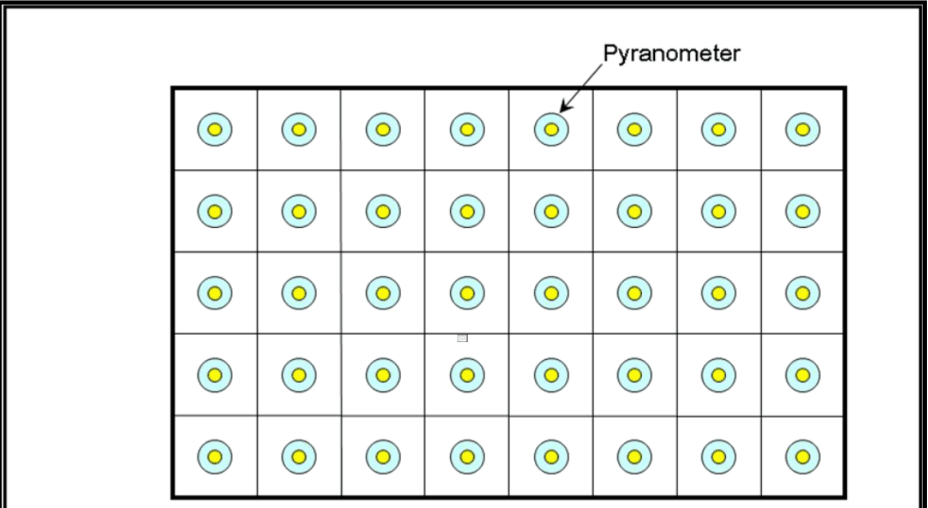
Figure description:
- Standard: MIL-STD-810H, Method 505.7, Annex C.
- Topic: Measurement of Total Irradiance across a surface.
- Key Entities:
- Pyranometer: Instrument represented by the blue/yellow circular icons, used to measure solar radiation.
- Grid Array: A 5x8 rectangular grid containing 40 individual pyranometer measurement points.
- Technical Detail: Total irradiance is the sum of energy for all spectral bandwidths at a point, with an allowable tolerance of ±4% or ±15W/m² (whichever is greater from the target value.
Total Irradiance - Sum of energy for all spectral bandwidths at a single measurement point on the diurnal curve (±4% or ±15W/m² (whichever is greater) of the target irradiance).
Irradiance Uniformity - Deviation between the measured and target irradiance at all measurement points on the target plane. The number of points shall be adequate to define irradiance variation across the target plane(s) to meet the specific test requirement (+10 percent deviation from the target irradiance).
NOTE: Grid size is typically unique to the chamber dimensions and solar simulator design.
Figure 505.7C-1. Example of establishing target and uniformity levels over surface target plane.
(2) If the test item is available, the test can be run using an established test plane or the actual surface of the test item. The test plane approach is best if the test item surfaces are in a reasonably horizontal plane with minimal height differences.
When the actual test surface is used for test set-up, a grid pattern is applied to the primary surfaces to establish solar radiation uniformity and, if desired, radiometers are placed at reference locations during the test to record and monitor radiation levels during the test.
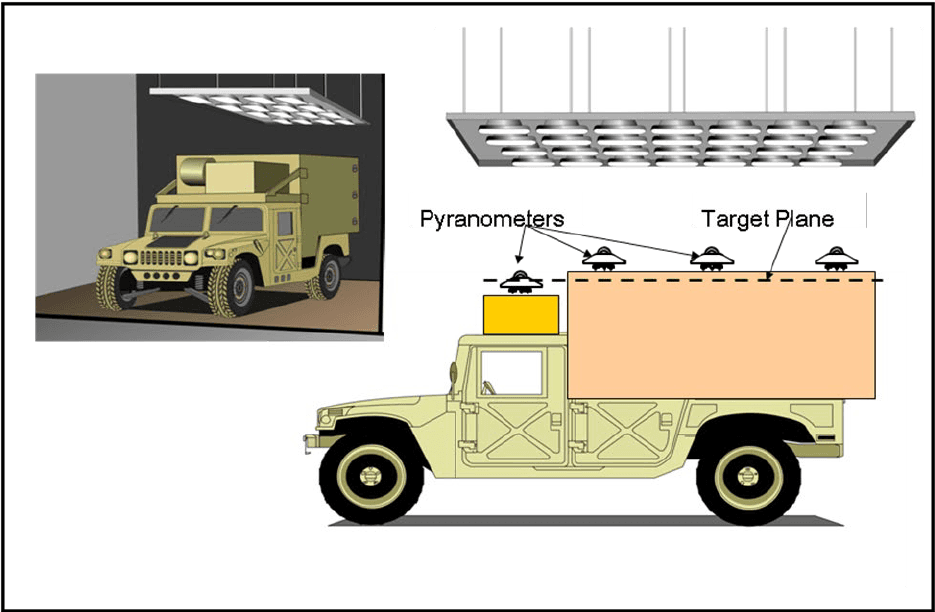
Figure description:
Key Information:
- Test Subject: A military vehicle (Humvee used for flat surface solar radiation exposure testing.
- Solar Lamp Array: An overhead lighting rig suspended above the vehicle to simulate solar radiation.
- Pyranometers: Four radiation-measuring sensors mounted at reference locations along the top of the vehicle.
- Target Plane: A designated horizontal reference line (dashed indicating the level at which radiation is monitored.
- Setup: The diagram illustrates a method to establish solar radiation uniformity across the primary surfaces of a test object.
Figure 505.7C-2. Example 1 – Flat surface exposure.
MIL-STD-810H METHOD 505.7, ANNEX C
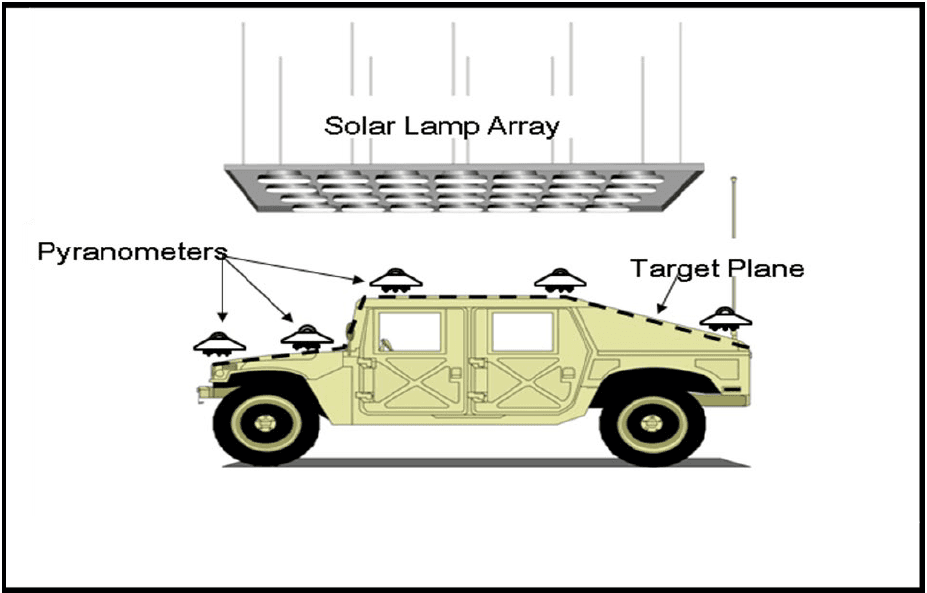
Figure description:
Entities and Key Information:
- Context: MIL-STD-810H, Method 505.7, Annex C (Solar Radiation testing.
- Test Item: Military vehicle (HMMWV representing a complex surface shape exposure.
- Solar Lamp Array: Overhead radiation source panel.
- Pyranometers: Sensors placed at multiple points (hood, roof, and rear deck to measure incident radiation.
- Target Plane: Indicated by a dashed line following the exterior upper contours of the vehicle.
Figure 505.7C-3. Example 2 - Test item surface shape exposure.
- (3) Test items with extreme height differences may require multiple test planes. For example, if a system has a raised antenna and an electronics enclosure at a lower height, a multiple test plane configuration would allow the best test results. In this case the upper test plane will receive the proper radiation by the main overhead simulated solar source, and an auxiliary simulated solar source is needed to provide the correct radiation level to the secondary test plane.
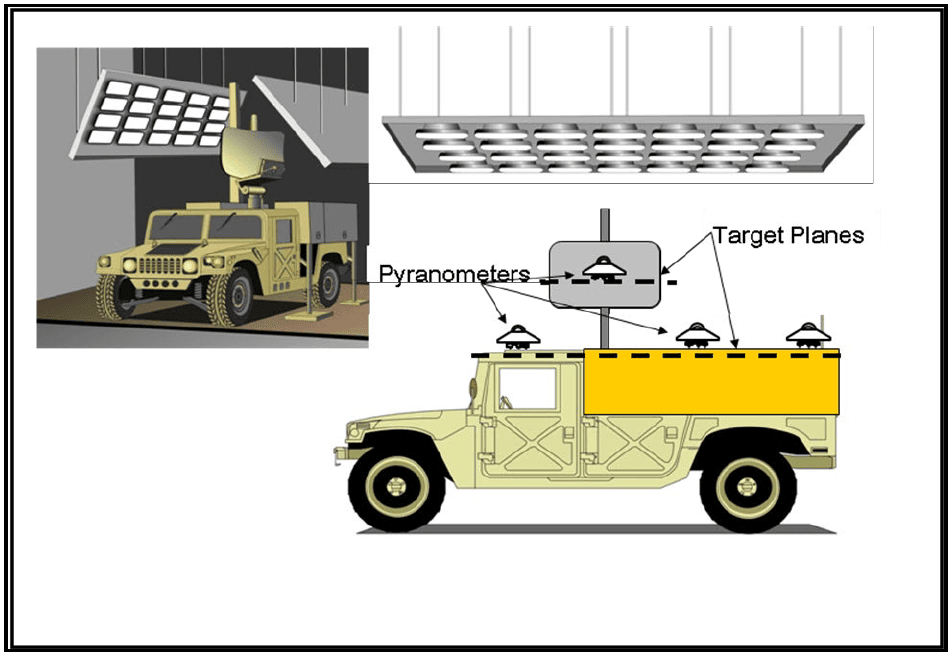
Figure description:
- Subject: Humvee (High Mobility Multipurpose Wheeled Vehicle in a solar simulation environment.
- Key Entities:
- Pyranometers: Sensors mounted on top of the vehicle (cab and rear and on a vertical mast to measure solar radiation.
- Target Planes: Indicated by dashed horizontal lines, representing the specific surfaces where solar intensity is being measured.
- Solar Simulation Lamp Arrays: Hanging overhead panels containing multiple lamps used to simulate solar radiation.
- Context: Figure 505.7C-4, showing an example of testing multiple solar surface target planes on a military vehicle.
Figure 505.7C-4. Example 3 - Multiple solar surface target planes.
- (4) Example of how to calculate the Spectral Power Distribution at a given total irradiance level with reference to Table 505.7-I.
| Spectral Region | Bandwidth (nm)² | Natural Radiation (% of total)² | Tolerance (% of total)² | Calculated Irradiance Tolerances For a Given Total Irradiance (W/m2) → 822.5¹ | |||||
|---|---|---|---|---|---|---|---|---|---|
| Min | Max | Nominal | Min | Max | |||||
| Ultraviolet - B | 280-320 | 0.5 | 0.3 | 0.7 | 4.1 | 2.5 | 5.8 | ||
| Ultraviolet - A | 320-360 | 2.4 | 1.8 | 3 | 19.7 | 14.8 | 34.5 | 24.7 | 60.9 |
| 360-400 | 3.2 | 2.4 | 4.4 | 26.3 | 19.7 | 36.2 | |||
| Visible | 400-520 | 17.9 | 16.1 | 19.7 | 147.2 | 132.4 | 360.3 | 162 | 468.8 |
| 520-640 | 16.6 | 14.9 | 18.3 | 136.5 | 122.6 | 150.5 | |||
| 640-800 | 17.3 | 12.8 | 19 | 142.3 | 105.3 | 156.3 | |||
| Infrared | 800-3000 | 42.1 | 33.7 | 50.5 | 346.3 | 277.2 | 415.4 | ||
Note: 1. The sum of energy in all spectral bands shall not exceed ±4% of total irradiance or ±15 W/m² (whichever is greater)
- The values in columns 2 through 5 were obtained from CIE-85 and DIN 75220, Table 1.
Spectral compliance is determined by measurement of individual bandwidth energy. The Table 505.7C-II right side provides calculated maximum and minimum bandwidth energy for the fifth step of Figure 505.7C-5 with a total energy of 822.5 W/m2. Individual bandwidth energy may be greater or less than the nominal value, however the irradiance sum must also be within ± 4 % of the total nominal irradiance. Application of the ± 4% tolerance to the target irradiance of 822.5 W/m2 results in the required product between 789.6 to 855.4 W/m2. Spectral compliance must be evaluated based on a single measurement point, not an average or composite of multiple points. The natural radiation energy/bandwidth percentage is the same for each diurnal cycle step as shown by comparison with Table 505.7C-I. The equations below are applicable to calculate energy in a partial bandwidth region for any total irradiance. The individual bandwidth energy minimum and maximum can be used to evaluate lamp degradation or the influence of multiple lamp types on spectral compliance.
For each bandwidth:
Nominal Irradiance = Min Irradiance = Max Irradiance = Therefore, for a total irradiance of 822.5 W/m² the tolerances for the Ultraviolet-B (UVB) band would be: Nominal Irradiance = Min Irradiance = Max Irradiance =
MIL-STD-810H
METHOD 505.7, ANNEX C
The second criteria is a uniform irradiance across a test item surface area (target plane). Method 505 uses the term “uniformity”, other documents may reference “non-uniformity”. Both terms define a deviation between measured and desired irradiance across positions on a measurement grid. A test item may have multiple grids or intensity requirements, but the basic evaluation is the same. The uniformity evaluation can be performed with an imaginary surface prior to placement of the test item in the chamber. Alternatively, measurements can be performed on the test item if pre-test irradiance exposure is acceptable. In either case, documentation of measurement grid points and irradiance is required to validate the test setup uniformity.
The central 3 x 4 target plane in Figure 505.7C-1 represents the Figure 505.7C-2 vehicle top surface. Each pyranometer represents one portion of the target plane area, additional pyranometers are distributed around the target plane. Figures 505.7C-3 and 505.7C-4 illustrate additional test configurations and target planes. Accurate uniformity for the vehicle antenna and lower electronics enclosure is best represented by a multiple target plane configuration. The upper plane receives irradiance from the main overhead array, and an auxiliary array is needed to provide irradiance to the lower plane. Screen mesh or other material above higher components can also be used to attenuate irradiance. The test configurations are for illustration only, actual testing must to be performed according to the test plan and as agreed between the contractual parties.
MIL-STD-810H
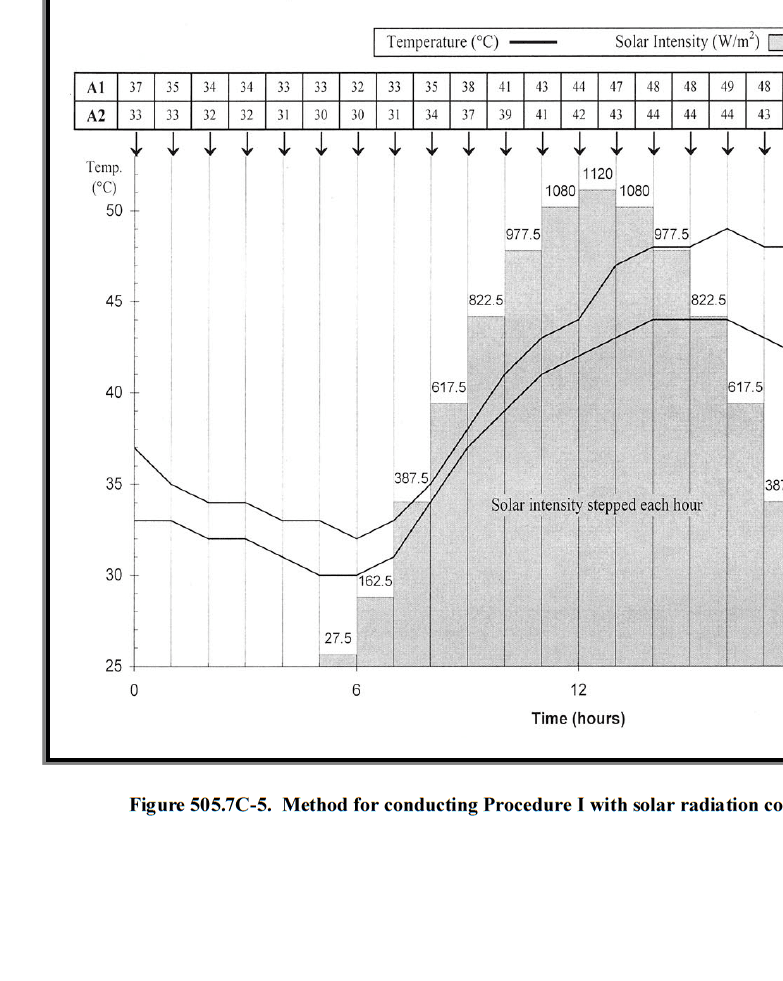
Figure description:
Figure 505.7C-5. Method for conducting Procedure I with solar radiation conditions
Method for conducting Procedure I with solar radiation conditions
Legend
- Temperature (°C — color: black; symbol: Solid line
- Solar Intensity (W/m² — color: grey; symbol: Shaded bars
Annotations
- Solar intensity stepped each hour (text_label - position: center of chart area)
| Time (hours) | Temperature A1 (°C) | Temperature A2 (°C) | Solar Intensity (W/m²) |
|---|---|---|---|
| 0 | 37 | 33 | 0 |
| 1 | 35 | 33 | 0 |
| 2 | 34 | 32 | 0 |
| 3 | 34 | 32 | 0 |
| 4 | 33 | 31 | 0 |
| 5 | 33 | 30 | 27.5 |
| 6 | 32 | 30 | 162.5 |
| 7 | 33 | 31 | 387.5 |
| 8 | 35 | 34 | 617.5 |
| 9 | 38 | 37 | 822.5 |
| 10 | 41 | 39 | 977.5 |
| 11 | 43 | 41 | 1080 |
| 12 | 44 | 42 | 1120 |
| 13 | 47 | 43 | 1080 |
| 14 | 48 | 44 | 977.5 |
| 15 | 48 | 44 | 822.5 |
| 16 | 49 | 44 | 617.5 |
| 17 | 48 | 43 | 387.5 |
Notes: The data table at the top of the figure provides specific Temperature (A1 and A2 values for each hour mark, indicated by arrows pointing down to the corresponding time on the x-axis. Solar intensity values are indicated by labels directly above each hourly shaded bar.)
4 52.5 olle
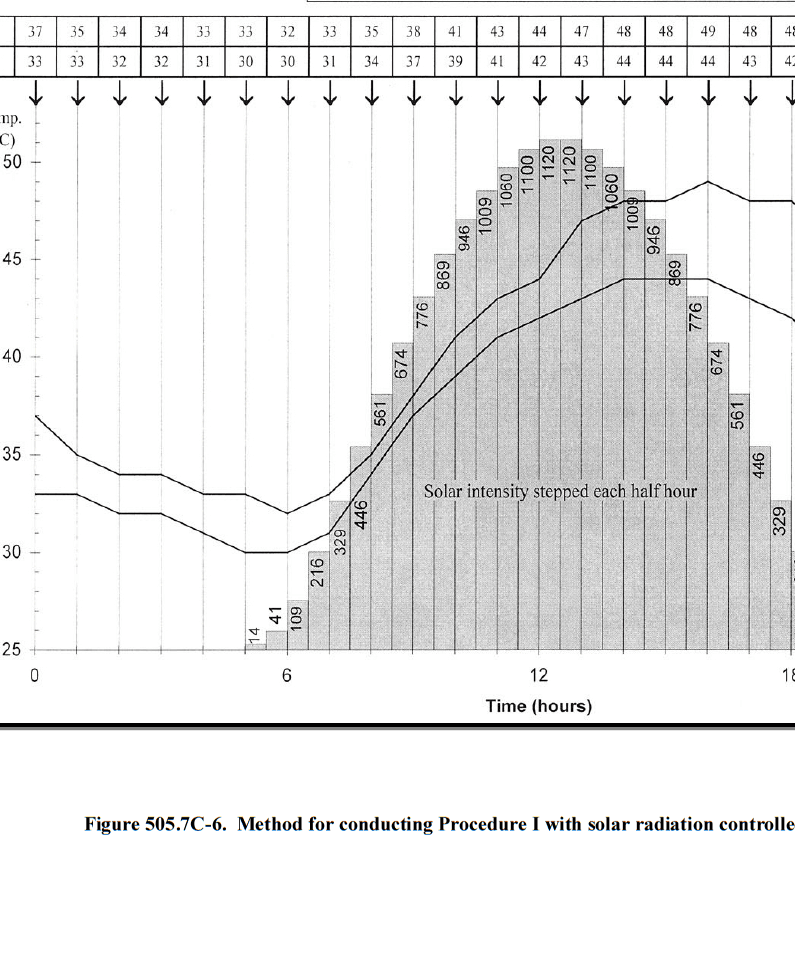
Figure description:
Figure 505.7C-6. Method for conducting Procedure I with solar radiation controlled
Solar Radiation and Temperature Cycle
Legend
- Upper Temperature Limit — color: black; symbol: solid line
- Lower Temperature Limit — color: black; symbol: solid line
- Solar Intensity — color: grey; symbol: bar
Annotations
- Solar intensity stepped each half hour (text_label - position: center of bar chart area)
- Temperature data table at each hour mark (text_label - position: top of the chart)
| Time (hours) | Upper Temperature (°C) | Lower Temperature (°C) | Solar Intensity | Interval |
|---|---|---|---|---|
| 0.0 | 37 | 33 | null | null |
| 1.0 | 35 | 33 | null | null |
| 2.0 | 34 | 32 | null | null |
| 3.0 | 34 | 32 | null | null |
| 4.0 | 33 | 31 | null | null |
| 5.0 | 33 | 30 | null | null |
| 5.25 | null | null | 14 | 5.0-5.5 |
| 5.75 | null | null | 41 | 5.5-6.0 |
| 6.0 | 32 | 30 | null | null |
| 6.25 | null | null | 109 | 6.0-6.5 |
| 6.75 | null | null | 216 | 6.5-7.0 |
| 7.0 | 33 | 31 | null | null |
| 7.25 | null | null | 329 | 7.0-7.5 |
| 7.75 | null | null | 446 | 7.5-8.0 |
| 8.0 | 35 | 34 | null | null |
| 8.25 | null | null | 561 | 8.0-8.5 |
| 8.75 | null | null | 674 | 8.5-9.0 |
| 9.0 | 38 | 37 | null | null |
| 9.25 | null | null | 776 | 9.0-9.5 |
| 9.75 | null | null | 869 | 9.5-10.0 |
| 10.0 | 41 | 39 | null | null |
| 10.25 | null | null | 946 | 10.0-10.5 |
| 10.75 | null | null | 1009 | 10.5-11.0 |
| 11.0 | 43 | 41 | null | null |
| 11.25 | null | null | 1060 | 11.0-11.5 |
| 11.75 | null | null | 1100 | 11.5-12.0 |
| 12.0 | 44 | 42 | null | null |
| 12.25 | null | null | 1120 | 12.0-12.5 |
| 12.75 | null | null | 1120 | 12.5-13.0 |
| 13.0 | 47 | 43 | null | null |
| 13.25 | null | null | 1100 | 13.0-13.5 |
| 13.75 | null | null | 1060 | 13.5-14.0 |
| 14.0 | 48 | 44 | null | null |
| 14.25 | null | null | 1009 | 14.0-14.5 |
| 14.75 | null | null | 946 | 14.5-15.0 |
| 15.0 | 48 | 44 | null | null |
| 15.25 | null | null | 869 | 15.0-15.5 |
| 15.75 | null | null | 776 | 15.5-16.0 |
| 16.0 | 49 | 44 | null | null |
| 16.25 | null | null | 674 | 16.0-16.5 |
| 16.75 | null | null | 561 | 16.5-17.0 |
| 17.0 | 48 | 43 | null | null |
| 17.25 | null | null | 446 | 17.0-17.5 |
| 17.75 | null | null | 329 | 17.5-18.0 |
| 18.0 | 48 | 42 | null | null |
Notes: The chart shows two temperature curves and a stepped solar intensity profile over an 18-hour period. Temperature values are explicitly listed in a table at the top of the chart for each hour. Solar intensity values are printed on top of each half-hour step bar.
MIL-STD-810H
nou
MIL-STD-810H
METHOD 506.6