3 Special considerations for materiel categories/modes
- a. Storage and transit. When preparing a materiel's mission profile, life cycle environmental profile, or an SRD, identify storage and transport environments and environmental limits that the materiel is required or desired to withstand (e.g., temperature, humidity, vibration levels, etc.). For severe storage/transport conditions that would generate high materiel costs to withstand, consider modifying storage/transit/platform conditions/designs as tradeoffs to materiel design requirements. Environmental conditions for storage and transit modes may be more severe than those of operational modes because of the possibility of induced/combined environments (e.g., heat, humidity, shock, vibration, etc.), higher levels of some factors (e.g., high temperature in temporary open storage or during delays between transit modes), or greater materiel exposure times.
- b. Design of sheltered materiel. This paragraph pertains to materiel that is intended to be deployed/operated within shelters. In this case, the shelter becomes the materiel platform, and the environmental characteristics that the sheltered materiel will see depend upon the location and design of the shelter. Not only design sheltered materiel to be transported (as part of a shelter assembly) to its use location, but also design it to be used under the conditions that exist within the shelter when the shelter is operated in the areas stipulated in its requirements documents. This includes storage conditions within shelters that are not controlled environmentally as well as operational conditions where environments are controlled. Also, design sheltered materiel to withstand environmental effects that occur during materiel relocation when the shelter is not available. The materiel developer should:
- (1) Develop or supply protective devices or modification kits, if required, that will permit shipment, storage, and operational use of such materiel in the environmental conditions for which it is intended.
- (2) Indicate by distinct marking at appropriate places on the materiel (where size makes this feasible), and by warning statements in technical manuals, the actual climatic stress limits that should not be exceeded in operational and non-operational modes.
- c. Effects of environments on user/system interfaces. As part of each materiel analysis conducted during the materiel acquisition cycle, the developmental and operational evaluators must consider environmental effects on the user/system interface. Special tests may be needed to address personnel survivability and habitability issues to ensure that crews can sustain operations in operational environments (DoDI 5000.02).
- d. Environmental considerations for potentially dangerous materiel. Design potentially dangerous materiel (e.g., ammunition and explosive materials/materiel, etc.) to include safety requirements based on the long-term, worldwide temperature extremes detailed under NATO STANAG 4370, MIL-HDBK-310, and AR 70-38, even though the materiel may not be intended for operational use at these extremes. This will prevent situations where explosive or other dangerous materiel that is developed for less than worldwide deployments is transported, stored, or used inadvertently in areas of unexpected extreme conditions thus possibly resulting in critical or catastrophic failure.
MIL-STD-810H
PART ONE ANNEX C
Figure description:
Map Subject: Global distribution of climatic categories based on MIL-STD-810H standards.
Climatic Categories (Legend:
- A1 EXTREME HOT DRY: Darkest orange/brown (primarily Sahara, Arabian Peninsula, parts of Central Asia/India, and Australian Outback.
- A2 HOT DRY: Medium orange (fringes of A1 zones, parts of Mexico/Southwest USA, and Southern Africa.
- A1 Hot Dry: Reddish-orange (smaller pockets within hot regions.
- A2 Basic Hot: Light orange/tan (widely distributed across equatorial and subtropical regions.
- A3 Intermediate: Yellow (temperate and northern/southern latitudes.
Key Regional Highlights:
- North America: Hot zones concentrated in the Southwest USA and Mexico.
- South America: Small hot pockets in northern Argentina and parts of Brazil.
- Africa/Middle East: Contains the largest contiguous area of "Extreme Hot Dry" (A1 and "Hot Dry" (A2 climates, spanning the Sahara to the Persian Gulf.
- Asia: Significant hot zones in India, Pakistan, and Western China/Central Asia.
- Australia: Central and western regions are predominantly "Extreme Hot Dry" and "Hot Dry."
- Unshaded Areas: Polar regions (Arctic/Antarctica and high northern latitudes are not categorized under these specific hot/dry labels.
MIL-STD-810H
PART ONE ANNEX
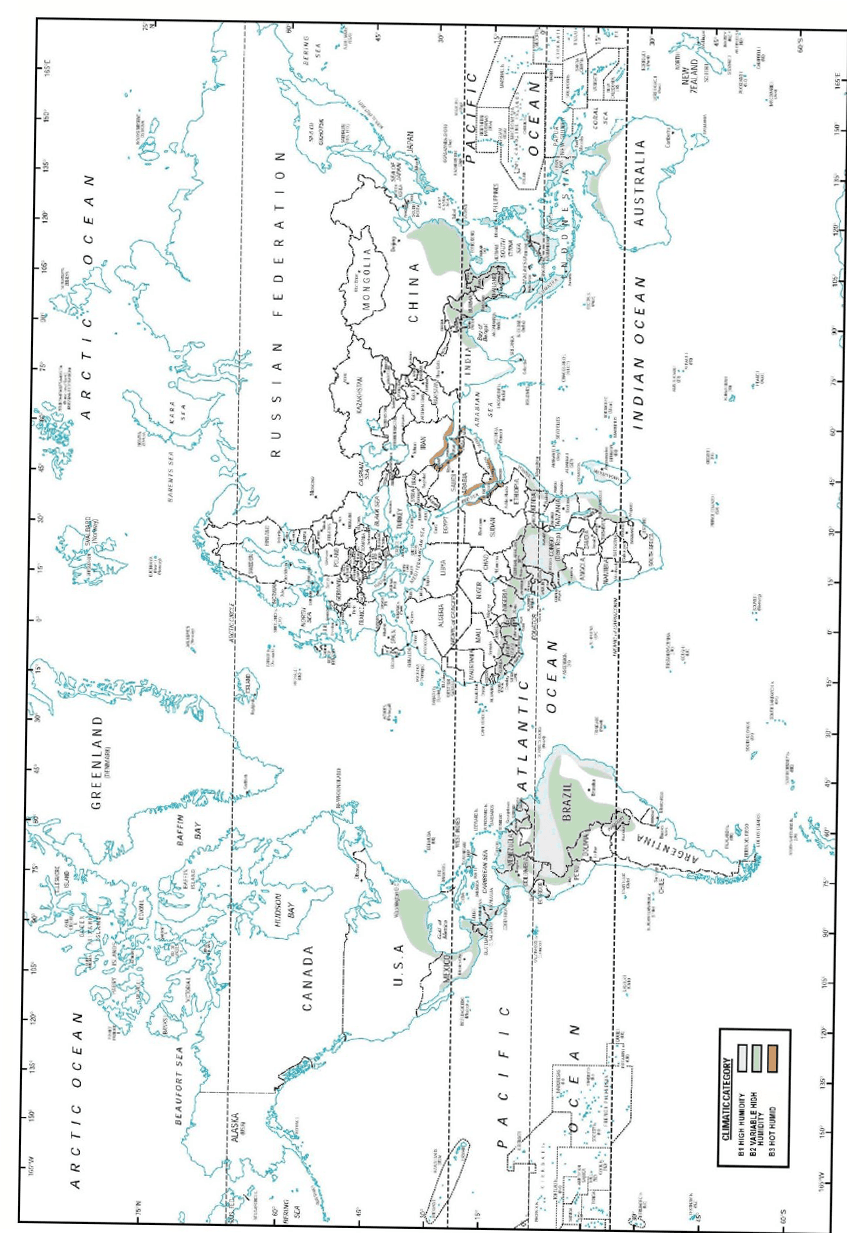
Figure description:
- Document Source: MIL-STD-810H, Part One, Annex C.
- Subject: World map illustrating the global distribution of specific climatic categories.
- Climatic Categories (Legend:
- B1 High Humidity (Green: Concentrated in equatorial regions including the Amazon Basin, Congo Basin, Southeast Asia, and northern Australia.
- B2 Variable High Humidity (Blue-green: Surrounds B1 zones, extending further into South America, Africa, and East Asia.
- B3 Hot Humid (Orange: Predominantly follows tropical and subtropical coastlines and includes various island chains in the Pacific and Indian Oceans.
- Key Entities: North and South America, Africa, Eurasia, Australia, and major oceans (Pacific, Atlantic, Indian, Arctic.
PART ONE-C-6
MIL-STD-810H PART ONE ANNE
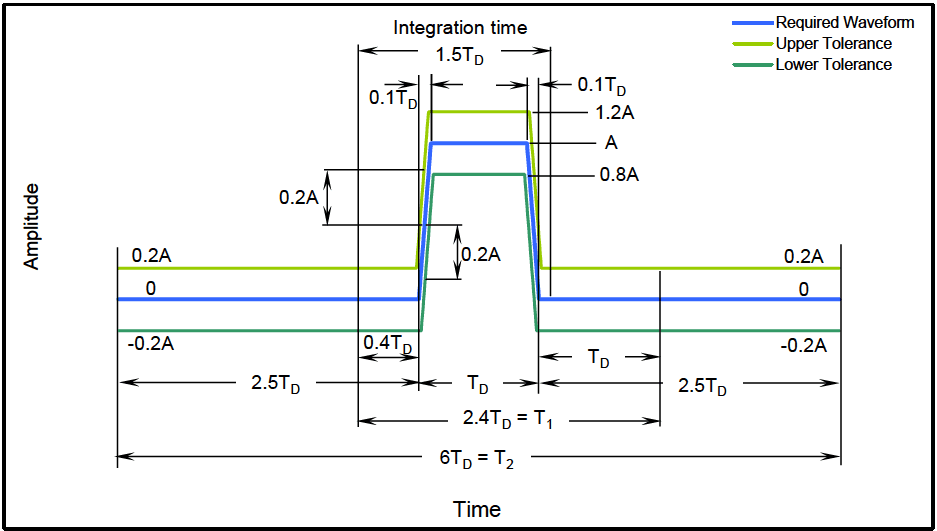
Figure description:
Global Distribution of Climatic Categories
CLIMATIC CATEGORY
Legend
- C0 Mild Cold — color: white; symbol: solid rectangle
- C1 Basic Cold — color: lightest blue; symbol: solid rectangle
- C2 Cold — color: light blue; symbol: solid rectangle
- C3 Severe Cold — color: medium blue/purple; symbol: solid rectangle
- C4 Extreme Cold — color: dark purple; symbol: solid rectangle
| Climatic Category | Description | Representative Geographic Regions |
|---|---|---|
| C0 | Mild Cold | Tropical and subtropical zones, including most of Africa, South America (except Patagonia/Andes, Australia, Southeast Asia, Southern US, Mexico, and India.) |
| C1 | Basic Cold | Central and Southern Canada, Northern and Central US, most of Europe, Southern Russia, Central Asia, Northern China, and Southern South America (Patagonia.) |
| C2 | Cold | Northern parts of Canada and Russia, Alaska, Scandinavia, and high-altitude regions such as the Tibetan Plateau and the Himalayas. |
| C3 | Severe Cold | Arctic islands of Canada, the coastal regions of Greenland, and large areas of Northeast Russia (Siberia.) |
| C4 | Extreme Cold | The interior of Greenland and the coldest interior regions of Northeastern Russia (Siberia.) |
Notes: The map displays global climatic categories from C0 (Mild Cold to C4 (Extreme Cold based on geographic distribution. Data is represented via color shading on a world map with latitude and longitude markers.))
PART ONE C 7
Table C-I. Summary of climatic conditions and daily cycles of temperature, solar radiation, and relative humidity
| Climatic Design Type | Daily Cycle¹ | Operational Conditions | Storage and Transit Conditions | Natural Environment Exposure Testing7 °C (°F) | |||||
|---|---|---|---|---|---|---|---|---|---|
| Ambient Air Temperature² °C (°F) | Solar Radiation W/m² (Bph³) | Ambient Relative Humidity %RH4 | Induced Air Temperature °C (°F) | Induced Relative Humidity %RH | |||||
| Daily Low | Daily High | Daily Low | Daily High | ||||||
| Hot | Hot Dry (A1) | 32 (90) | 49 (120) | 0 to 1120 (0 to 355) | 8 to 3 | 33 (91) | 71 (160) | 7 to 1 | 32 to 49 (90 to 120) |
| Hot Humid (B3) | 31 (88) | 41 (105) | 0 to 1080 (0 to 343) | 88 to 59 | 33 (91) | 71 (160) | 80 to 14 | Coastal Desert | |
| Basic | Basic Hot (A2) | 30 (86) | 43 (110) | 0 to 1120 (0 to 355) | 44 to 14 | 30 (86) | 63 (145) | 44 to 5 | 0 to 43 (32 to 110) |
| Intermediate6 (A3) | 28 (82) | 39 (102) | 0 to 1020 (0 to 323) | 78 to 43 | 28 (82) | 58 (136) | See note 5 | ||
| Variable High Humidity (B2) | 26 (78) | 35 (95) | 0 to 970 (0 to 307) | 100 to 74 | 30 (86) | 63 (145) | 75 to 19 | Humid Tropics | |
| Constant High Humidity (B1) | Nearly Constant 24 (75) | Negligible | 95 to 100 | Nearly Constant 27 (80) | 95 to 100 | ||||
| Mild Cold6 (C0) | -19 (-2) | -6 (21) | Negligible | Tending toward saturation | -21 (-6) | -10 (14) | Tending toward saturation | 0 to -32 (32 to -25) | |
| Basic Cold (C1) | -32 (-25) | -21 (-5) | Negligible | Tending toward saturation | -33 (-28) | -25 (-13) | Tending toward saturation | ||
| Cold | Cold (C2) | -46 (-50) | -37 (-35) | Negligible | Tending toward saturation | -46 (-50) | -37 (-35) | Tending toward saturation | -32 to -46 (-26 to -50) |
| Severe Cold | Severe Cold (C3) | -51 (-60) | Negligible | Tending toward saturation | -51 (-60) | Tending toward saturation | <-46 (<-50) | ||
| Extreme Cold | Extreme Cold6 (C4) | -57 (-70) | Negligible | Tending toward saturation | -57 (-70) | Tending toward saturation | |||
- ¹ Designations in parentheses refer to corresponding climatic categories in MIL-HDBK-310 and AR-70-38 (except the A-3 category) and NATO STANAG 4370, AECTP 230; (see Part One, 2.2.1, 2.2.2, and 2.3).
- ² °C values (rounded to the nearest whole degree) derived from data obtained/established on °F scale.
- ³ Bph represents British Thermal Units per square foot per hour.
- 4 Sequence of RH presentation corresponds to sequence of air temperatures shown (e.g., for HOT-DRY daily cycle, 8 percent RH occurs at 32°C (90°F); 3 percent RH occurs at 49°C (120°F).
- ^5 Relative humidity for the A3 storage condition vary to widely between different situations to be represented by a single set of conditions.
- 6 Values are only found in NATO STANAG 4370, AECTP 230.
- 7 Delineation to be used for natural environment exposure testing, not applicable to laboratory testing.
NOTE: The numbers shown for the values of the climatic elements represent only the upper and lower limits of the cycles that typify days during which the extremes occur; e.g., for the Hot-Dry cycle, 49°C (120°F) is the maximum daytime temperature, and 32°C (90°F) is the minimum nighttime (or early morning) temperature.
MIL-STD-810H
PART ONE ANNEX C
Table C-II. Summary of potential environments for the STORAGE PHASE
| SITUATIONS | NATURAL | INDUCED |
|---|---|---|
| a. Depot | Controlled or known temperature and humidity | Shock due to handling and drop |
| Vibration due to handling | ||
| Conducted EM interference due to testing | ||
| Nuclear effects | ||
| b. Sheltered | High temperature (Dry/Humid) | Shock due to handling |
| Low temperature | Vibration due to handling | |
| Freeze/thaw | Conducted EM interference due to testing | |
| Salt mist | Susceptibility to EM radiation | |
| Chemical attack | Nuclear effects | |
| Fungal growth | Free fall drop | |
| Diurnal (cycling temperature) | ||
| c. Open | High temperature (Dry/Humid) | Shock due to handling |
| Low temperature | Vibration due to handling | |
| Freeze/thaw | Conducted EM interference due to testing | |
| Sand and dust | Susceptibility to EM radiation | |
| Salt mist | Electrostatic discharge (handling) | |
| Solar radiation | Lightning | |
| Chemical attack | Nuclear effects | |
| Fungal growth | Free fall drop | |
| Rain, hail, snow, ice | ||
| Diurnal (cycling temperature) |
Table C-III. Summary of potential environments for the TRANSPORTATION PHASE
| SITUATIONS | NATURAL | INDUCED | |
|---|---|---|---|
| a. Road | High temperature (Dry/Humid) | Shock due to road surface and handling | |
| Low temperature | Vibration due to road surface and engine | ||
| Rain, hail, snow, ice | Susceptibility to EM radiation | ||
| Sand and dust | Lightning | ||
| Solar radiation | Electrostatic discharge (handling) | ||
| Immersion/Fording | Free fall drop | ||
| b. Rail | High temperature (Dry/Humid) | Shock due to rail transport and handling | |
| Low temperature | Vibration due to rails | ||
| Rain, hail, snow, ice | Free fall drop | ||
| Sand and dust | |||
| Solar radiation | |||
| c. Air | High temperature (Dry/Humid) | Shock due to landing and handling | |
| Low temperature | Vibration due to engines and airflow | ||
| Reduced pressure | Free fall drop | ||
| Rapid pressure change | |||
| Sand and dust | |||
| Solar radiation | |||
| Rain, hail, snow, ice | |||
MIL-STD-810H
PART ONE ANNEX C
Table C-III (Con't). Summary of potential environments for the TRANSPORTATION PHASE
| SITUATIONS | NATURAL | INDUCED |
|---|---|---|
| d. Sea | High temperature (Dry/Humid) | Shock due to wave motion, underwater weapon detonation, and handling |
| Low temperature | Vibration due to wave motion and engine | |
| Rain, hail, snow, ice | Free fall drop | |
| Salt mist | ||
| Sand and dust | ||
| Solar radiation | ||
| Temporary immersion | ||
| Fugal growth |
Table C-IV. Summary of potential environments for the DEPLOYMENT PHASE
| SITUATIONS | NATURAL | INDUCED |
|---|---|---|
| a. Man Carried | High temperature (Dry/Humid) | Shock due to weapon firing and handling |
| Low temperature | Acoustic noise | |
| Freeze/thaw | Nuclear effects | |
| Rain, hail, snow, ice | EM interference | |
| Sand, dust, and mud | Electrostatic discharge | |
| Salt mist | Chemical and biological attack | |
| Solar radiation | Corrosive atmosphere | |
| Fugal growth | Free fall drop | |
| Chemical attack | Immersion | |
| b. Tracked & Wheeled Vehicle | High temperature (Dry/Humid) | Shock due to road surface, weapon firing, detonation, and handling |
| Low temperature | Vibration due to road surface and engine | |
| Freeze/thaw | High temperature due to glassed enclosure | |
| Rain, hail, snow, ice | Acoustic noise | |
| Sand, dust, and mud | Nuclear effects | |
| Salt mist | EM interference | |
| Solar radiation | Electrostatic discharge | |
| Fugal growth | Lightning | |
| Chemical attack | Chemical and biological attack | |
| Temperature shock | Corrosive atmosphere | |
| Immersion/Fording | Free fall drop | |
| c. Fixed Wing & Rotary Aircraft | High temperature (Dry/Humid) | Shock due to assisted take-off, landing, and weapon blast |
| Low temperature | Vibration due to runway surface, air maneuver, gunfire, aerodynamics, blade tones, engine, and air turbulence | |
| Freeze/thaw | Aerodynamic heating | |
| Rain | Nuclear effects | |
| Sand and dust | EM interference | |
| Salt mist | Electrostatic discharge | |
| Solar radiation | Lightning | |
| Rain and dust erosion | Corrosive atmosphere |
MIL-STD-810H
PART ONE ANNEX C
Table C-IV (Con’t). Summary of potential environments for the DEPLOYMENT PHASE
| SITUATIONS | NATURAL | INDUCED |
|---|---|---|
| c. Fixed Wing & Rotary Aircraft | Fungal growth | Noise |
| (Con’t) | ||
| Chemical attack | Free fall drop | |
| Bird strike | Contamination by fluids | |
| Low pressure | ||
| Hail | ||
| Rapid temp/humidity change | ||
| Rapid pressure change | ||
| Icing | ||
| d. Ship & Submarine | High temperature (Dry/Humid) | Shock due to weapon firing, detonation, and wave slam |
| Low temperature | Vibration due to waves, engine, acoustic noise | |
| Freeze/thaw | Nuclear effects | |
| Rain, hail, snow, ice | EM interference | |
| Salt mist | Electrostatic discharge | |
| Solar radiation | Lightning | |
| Fungal growth | Corrosive atmosphere | |
| Chemical attack | Increased pressure (submarine) Underwater detonation Free fall drop | |
| e. Stationary Equipment | High temperature (Dry/Humid) | Shock due to weapon firing and detonation |
| Low temperature | Vibration due to engines and mechanical movement | |
| Freeze/thaw | Acoustic noise | |
| Rain, hail, snow, ice | Nuclear effects | |
| Salt mist | EM interference | |
| Solar radiation | Electrostatic discharge | |
| Fungal growth | Lightning | |
| Chemical attack | Corrosive atmosphere | |
| f. Projectile Free Flight | Rain and dust erosion | Shock due to firing and target impact |
| Wind | Acceleration due to firing Aerodynamic heating Acoustic noise Nuclear effects EM interference Electrostatic discharge Lightning | |
| g. Torpedo Launch | Immersion | Shock due to launch boost separation and target impact |
| Thermal shock | Vibration due to engine and hydrodynamic and aerodynamic turbulence | |
| Pressure | Launch acceleration Acoustic noise |
MIL-STD-810H
PART ONE ANNEX C
Table C-IV (Con't). Summary of potential environments for the DEPLOYMENT PHASE
| SITUATIONS | NATURAL | INDUCED |
|---|---|---|
| g. Torpedo Launch (Con’t) | Nuclear effects EM interference | |
| h. Missile Free Flight | Rain and dust erosion | Shock due to launch, boost separation and target impact Vibration due to engine and aerodynamic turbulence Launch acceleration Acoustic noise Nuclear effects EM interference Electrostatic discharge Lightning Aerodynamic heating |
MIL-STD-810H
PART ONE ANNEX D
PART ONE ANNEX D¹ TERMINOLOGY FOR DYNAMIC (MECHANICAL) TEST METHODS
- a. AC-coupling. In signal processing, this term implies the removal of any zero frequency information from the time history trace. In digitizing a signal, the analog-to-digital converter is said to be AC-coupled, if there exists a high pass filter in the digitizing process. Typically, piezoelectric devices are AC-coupled because of their inability to respond to static voltages.
- b. Autocorrelation function. For x(t), a function of time, the autocorrelation function, , is defined to be the following average over an averaging time, T,
If the average is also a function of time, t, such that
then, this is a form of nonstationary autocorrelation function.
- c. Autospectral density function (also known as power spectral density function). For a stationary (ergodic) random process {x(t)} for which the finite Fourier transform of x(t) is given by:
the two-sided autospectral density of x(t) is defined by:
for E, the expected value operator. A one-sided estimate of the autospectral density function of x(t) over distinct records, each of length T, is given by the following average of finite Fourier transforms:
In processing, the distinct records of length T may be windowed in the time domain to reduce spectral leakage, and the processing may be “overlapped” to restore degrees of freedom lost in the windowing process. Other processing options include the estimate processing in the frequency domain convolving basic frequency domain estimates with a selected window function defined in the frequency domain.
- d. Classical pulse. A short duration transient time history defined by p(t) for 0 ≤ t ≤ T < ∞, having the form of a half-sine, a square wave, a triangular wave, a ramp with a terminal peak amplitude, a ramp with an initial peak amplitude, or a general trapezoid.
- e. Combination control. A form of vibration system control that combines response control and force limit control in order to ensure measured or specified test spectra levels are met without inputs that provide for substantial overtest or undertest. Combination control requirements arise as a result of impedance mismatches between measured in-service materiel configuration response and laboratory test materiel configuration response. Use of response control alone may result in severe overtest spectra levels or undertest spectra levels at various frequencies.
MIL-STD-810H
PART ONE ANNEX D
- f. Cross-correlation function. For x(t) and y(t) functions of time, the cross correlation function, , is defined to be the following average over an averaging time, T:
If the average Rxy(τ) is also a function of time, t, (Rxy(τ, t)) such that
then, this is a form of nonstationary cross correlation function.
- g. Cross-spectral density function. For stationary (ergodic) random processes {x(t)} and {y(t)} for which finite Fourier transforms of x(t) and y(t) are respectively,
the two-sided cross-spectral density function of x(t) and y(t) is defined by:
An estimate of the one-sided cross-spectral density function of x(t) and y(t) over distinct records, each of length T, is given by the following average of finite Fourier transforms:
In processing, the distinct records of length “T” may be windowed in the time domain to reduce spectral leakage, and the processing may be “overlapped” to restore degrees of freedom lost in the windowing process. Other processing options include the estimate processing in the frequency domain convolving basic frequency domain estimates with a selected window function defined in the frequency domain.
h. Decibel (dB). The decibel (one tenth of a bel) is the logarithm of a ratio of two values. Generally the value in the denominator is termed the reference value. The reference value represents the power or amplitude level to which the decibel computation is referenced and must accompany any plot with an axis labeled decibels. For power quantities (e.g. noise, pressure, PSD, etc) it is given by:
dB = 10 log10 (P1/P0) for reference power level P0
For linear quantities (e.g. acceleration, velocity, etc) it is given by:
dB = 20 log10 (L1/L0)
for reference linear level L0
i. DC-coupling. In signal processing, this term implies the retention of all zero frequency information in a time history trace. In digitizing a signal, the analog-to-digital converter is said to be DC-coupled if there is no high pass filter in the digitizing process. Typically, piezoresistive devices are DC-coupled because of their ability to retain the magnitude of static voltages.
- j. Energy autospectral density function. For a time limited history x(t) defined for 0 ≤ t ≤ T < ∞ with finite Fourier transform
the two-sided energy autospectral density function of is given by:
MIL-STD-810H
PART ONE ANNEX D
for E, an ensemble average over available single records. A one-sided estimate of this function is given by:
To reduce the variance in the estimate , a direct average of independent "equivalent" time limited events, x(t), may be computed. The events generally will be replications of a given experiment, and will be considered as a time history ensemble. In processing, x(t) will not be windowed in the time domain, but include all significant energy in the experiment.
- k. Energy cross-spectral density function. For time and band limited time histories x(t) and y(t) defined for 0≤ t ≤ T < ∞ with finite Fourier transforms.
the two-sided energy cross-spectral density function of x(t) and y(t) is given by:
Lxy(f,T) = E {| X* (f,T)Y (f, T)|} -∞ <f< ∞
for E, an ensemble average over available single records. A one-sided estimate of this function is given by:
To reduce the variance in the estimate , a direct average of independent "equivalent" time limited events, x(t), y(t), may be computed. The events generally will be replications of a given experiment, and will be considered as a time history ensemble. In processing, neither x(t), y(t) will be windowed in the time domain.
- Energy frequency response function. For time limited histories x(t) and y(t) defined for 0 ≤ t ≤ T < ∞ with energy cross-spectral density function L_{xy}(f,T) and energy autospectral density function L_{xx}(f,T), the energy frequency response function is defined as:
A one-sided estimate of this function is given by:
.
where and may represent averages over a given ensemble of independent equivalent time limited events, x(t) and y(t). Averaging may reduce the variance in the estimate
that is taken as the quotient of two stable averages and .
Note: The term “frequency response function” is used here preserving the term “transfer function” for the Laplace transform of the unit impulse response function.
- m. Ensemble. A collection of sample time history records from a single random process where each of the time history records is defined over the same duration time interval. The notation for an ensemble
representing a random process x(t) is . If the ensemble has N members over time , the notation is .
- n. Ergodic (nonergodic) process. A random process that may be represented by an ensemble of time history records for which the time averaged parameters of any one time history record from the ensemble is representative of the time averaged parameters of the ensemble of time history records. An ergodic random process is a stationary random process. A random process that does not satisfy the above definition is termed nonergodic. Procedures for the determination of nonergodicity of a random process may take a number of forms. A stationary process may be also ergodic, whereas an ergodic process is always stationary.
- o. Filter. Fourier spectrum transformation of a given input time history, x(t), in order to produce a desired effect. Such filtering may be through band limiting the time history spectra through lowpass, highpass, bandpass, or bandstop forms of filtering. Filtering may be performed equivalently in either the time domain or the frequency domain. If the filtering transformation preserves the phase relationships between the input and output frequency components, the filter is referred to as a linear phase filter. If the filtering transformation distorts the phase relationships between input and output frequency components, the filter is referred to as a nonlinear phase filter. Further terminology related to filtering is provided in Method 516.5 and Method 517.
- p. Force limit control. A form of vibration system control that attempts to limit the input interface test levels to those levels measured or specified at the interface. In general, the levels measured or specified at the interface are in terms of force input to the test item interface or the test item interface mount.
- q. Fourier transform and finite Fourier transform. For a time history, x(t), defined for -∞ < t < ∞, the Fourier transform of x(t) is defined as a complex-valued function of frequency, f, when the integral exists. X(f) is termed the direct Fourier transform of x(t) and x(t) is termed the inverse Fourier transform of X(f).
For a time history x(t), defined for 0≤t≤T<, the finite Fourier transform of x(t) is defined as a complex- valued function of frequency f.
is termed the direct finite Fourier transform of ; and is termed the inverse finite Fourier transform of . The finite Fourier transform always exists for well defined . represents the complex conjugate of .)
- r. Gaussian (non-Gaussian) process. For x(t), a stationary random process that obeys the following probability density function at any time t for and constants:
then x(t) will be considered to be a Gaussian stationary random process. Conversely, for x(t) a random process that does not obey the probability density function at some time, t, will be considered to be non-Gaussian. This definition is not restricted to ergodic random processes.
s. Inverse Fourier transform and inverse finite Fourier transform. For the Fourier transform X(f), defined for - , the inverse Fourier transform of X(f) is defined as a real valued function of time, t:
when the integral exists. x(t) is termed the inverse Fourier transform of X(f), and X(f) is termed the Fourier transform of x(t).
MIL-STD-810H
PART ONE ANNEX D
For the finite Fourier transform defined over a frequency band of , the inverse finite Fourier transform of is defined as a real-valued function of time, t:
x(t) = x (f,T)ej²лf df 2π -F j2πft -00 <t< ∞
x(t) is termed the inverse finite Fourier transform of X(f,T) and X(f,T) is termed the finite Fourier transform of x(t), . The inverse finite Fourier transform always exists for well defined X(f,T), and is periodic in t.
- t. Linear system. A system in which scaled and additive inputs result in scaled and additive outputs. That is, for y = h(x) representation of a linear system, h, then for c, a constant, and x, x1, x2 inputs the following input/output relationships are defined:
System homogeneity:
System superposition:
- u. Mean (ensemble). For an ensemble of N time history records, , with a mean , an unbiased estimate of the mean of the ensemble at time is given by:
is the first moment of the random process .
v. Mean-square (ensemble). For an ensemble {xᵢ(t): 0 ≤ t ≤ T < ∞, i = 1,2, N} of N time history records with a mean square p(t), 0 ≤ t ≤ T, an unbiased estimate of the mean-square for the ensemble at time t is given by:
is the second moment of the random process .
w. Nonlinear system. A system that is not linear in that either the system homogeneity requirement or the system superposition requirement or both are violated. For y = h(x) representation of system h, then for c, a constant, and , inputs, either
cy = ch(x) ≠ h(cx)
or
or both.
x. Non-stationary process. A nonstationary random process is an ensemble of time history records that cannot be defined to be stationary. In general, the statistical properties of a nonstationary process are a function of time and not invariant with respect to time translations. In this Standard, if either the mean (first moment) estimate or mean-square (second moment) estimate, or both from a random process ensemble vary with time over the ensemble, the random process is considered nonstationary. If the ensemble has a deterministic component that varies in time, the ensemble may or may not be considered nonstationary depending on whether the random part of the ensemble is nonstationary or stationary.
- y. Power spectral density function. See “autospectral density function”, in subparagraph “c.”, above.
- z. Pulse. For purpose of this Standard, a pulse is a finite duration deterministic or random time history. In cases in which the pulse is related to the response in testing of materiel, the duration is generally no longer than five times the period of the lowest natural frequency of the materiel under consideration, and may be substantially shorter.
aa. Random process. A random process is represented by an ensemble of time history records that have properties described in terms of parameters estimated from statistical computations at selected times. In this standard it will be assumed that one or more sample records from the random process are related to a repeatable experiment that completely describes the phenomenon under consideration.
- bb. Response control. A form of vibration system control that attempts to match the response of materiel at one or more points with measured or specified vibration data at one or more points on the materiel. Vibration control system operational procedures provide for a variety of response matching options, e.g., single point control, multipoint control, average control, extreme control, etc.
- cc. Root-mean-square (ensemble). For an ensemble of N time history records with a mean square p(t), , (estimated by , an estimate of the root-mean-square for the ensemble at time t is given by:
- dd. Sample function. One particular realization of a random process that may be used to form an ensemble representation for the random process.
- ee. Single degree of freedom (SDOF). A single degree-of-freedom system is one for which only one coordinate is required to define completely the configuration of the system at any instant.
- ff. Spectrum. The representation of a time history in terms of a function of frequency. The representation, in general, will occur as a result of analyzing the time history with the Fourier transform and may be real or complex. (In the case of time history data analyzed by way of the shock response spectrum engineering tool, the representation is in terms of real amplitude and the natural frequency of a single degree of freedom system.)
gg. Standard deviation (ensemble). For an ensemble {xi(t): } of N time history records with a mean, , and a standard deviation, , , where the mean is estimated by , an unbiased estimate of the standard deviation of the ensemble at time t is given by:
- hh. Stationary process. A stationary random process is an ensemble of time history records that has statistical properties that are not a function of time and, hence, are invariant with respect to time translations. The stationary random process may be ergodic or nonergodic.
- ii. Statistical degrees of freedom (Statistical DOF). The number of values in the final calculation of a statistic that are free to vary. The number of degrees-of-freedom determines the statistical confidence of an estimate. When time-averaging is used in the analysis of the variance of random data, the effective number of statistical degrees of freedom is n = 2BT, where B is the effective filter bandwidth (analysis bandwidth) and T is the overall effective averaging time. For exponential spectral averaging it can be demonstrated that n = 2nd (2k - 1), where na = the number of distinct data blocks in the linear average and k = the number of distinct data blocks in the exponential average. Setting k=1 implies linear spectral averaging yielding n = 2nd -
jj. Transient vibration. A form of nonstationary random vibration time history that has a positive time- varying envelope that begins at zero and ends at zero over a certain period of time, . In general, for a(t), , the time-varying deterministic envelope function with frequency content below significant frequency content in the stationary random vibration time history, x(t), the transient vibration may be modeled in terms of the product model
y(t) = a(t)x(t) A condition for application of this model to random data is
for some and where . This condition helps ensure a(t) does not significantly modulate x(t).
kk. Variance (ensemble). For an ensemble of N time history records with a mean and a variance , , where is estimated by , an unbiased estimate of the variance of the ensemble at time t is given by:
ll. Waveform control. A form of vibration system control in which the system replicates a properly compensated time history, x(t), in an open loop (no feedback) mode of control. In this Standard, waveform control will refer to the replication of measured materiel response in laboratory testing based upon determining the input voltage time history to the vibration control system that will nearly exactly reproduce the measured materiel response when applied to the vibration system.
Downloaded from https://www.everyspec.com
MIL-STD-810H PART ONE ANNEX D
(This page is intentionally blank.)
MIL-STD-810H PART TWO
PART TWO -- LABORATORY TEST METHODS
TABLE OF CONTENTS
| No. | Title | Pages | No. of pages |
|---|---|---|---|
| 500 | Low Pressure (Altitude) | 500.6-i – 500.6-8 | 10 |
| 501 | High Temperature | 501.7-i – 501.7-14 | 16 |
| 502 | Low Temperature | 502.7-i – 502.7-10 | 12 |
| 503 | Temperature Shock | 503.7-i – 503.7-14 | 16 |
| 504 | Contamination by Fluids | 504.3-i – 504.3C-2 | 20 |
| 505 | Solar Radiation (Sunshine) | 505.7-i – 505.7C-8 | 36 |
| 506 | Rain | 506.6-i – 506.6-14 | 16 |
| 507 | Humidity | 507.6-i – 507.6A-2 | 24 |
| 508 | Fungus | 508.8-i – 508.8B-2 | 20 |
| 509 | Salt Fog | 509.7-i – 509.7-10 | 12 |
| 510 | Sand and Dust | 510.7-i – 510.7-14 | 16 |
| 511 | Explosive Atmosphere | 511.7-i – 511.7-10 | 12 |
| 512 | Immersion | 512.6-i – 512.6-8 | 10 |
| 513 | Acceleration | 513.8-i – 513.8A-8 | 24 |
| 514 | Vibration | 514.8-i – 514.8F-F2 | 180 |
| 515 | Acoustic Noise | 515.8-i – 515.8B-4 | 26 |
| 516 | Shock | 516.8-i – 516.8B-8 | 79 |
| 517 | Pyroshock | 517.3-i – 517.3A-10 | 44 |
| 518 | Acidic Atmosphere | 518.2-i – 518.2-8 | 10 |
| 519 | Gunfire Shock | 519.8-i – 519.8E-8 | 86 |
| 520 | Temperature, Humidity, Vibration, and Altitude | 520.5-i – 520.5-24 | 26 |
| 521 | Icing/Freezing Rain | 521.4-i – 521.4-8 | 10 |
| 522 | Ballistic Shock | 522.2-i – 522.2-20 | 22 |
| 523 | Vibro-Acoustic/Temperature | 523.4-i – 523.4A-8 | 30 |
| 524 | Freeze-Thaw | 524.1-i – 524.1-6 | 8 |
| 525 | Time Waveform Replication | 525.2-i – 525.2B-10 | 58 |
| 526 | Rail Impact | 526.2-i – 526.2-10 | 12 |
| 527 | Multi-Exciter Testing | 527.2-i – 527.2E-38 | 80 |
| 528 | Mechanical Vibrations Of Shipboard Materiel (Type I - Environmental And Type II - Internally Excited) | 528.1-i – 528.1B-4 | 32 |
| Part One | Environmental Engineering Program Guidelines | PART ONE-i – PART ONE D-8 | 80 |
| Part Two | Laboratory Test Methods | PART TWO-i – 528.1B-4 | 949 |
| Part Three | World Climatic Regions - Guidance | PART THREE-i – PART THREE C-2 | 57 |
Downloaded from https://www.everyspec.com
MIL-STD-810H PART TWO
(This page is intentionally blank.)
MIL-STD-810H METHOD
3.9
ASD Adjusted to Test Time (Col. I) – The g2/Hz level of Column H is adjusted using Equation 9-5 to account for the difference in the scenario time (Column D) and the actual test time (Column E). A value of m= 7.50 is generally used when the engineering units are g2/Hz.
3.10
Random Test Level (Col. J) - The g2/Hz levels of Column I are scaled by a conservatism factor, generally 1.4, resulting in the narrowband random test levels of Column J. The conservatism factor is intended to account for variations in level due to differences in road conditions, road conditions not considered, drivers, pilots, weather conditions, and other relevant variables. These are the final narrowband test levels that will be included in the LVTS.
3.11
Ratio Adjusted to Normalized (Col. K) – This column contains the ratio of the “ASD adjusted to test time” to the “bandwidth normalized ASD levels” (Column I / Column H). This is to assure that excessive exaggeration has not been applied. Observe that commercially available vibration control systems currently restrict sweep rates to be either linear or logarithmic which, unfortunately, is generally not typical of most mission scenarios (i.e., refer to the shape of the speed distribution produced by a beta distribution). Forcing the narrowbands to sweep in either a linear or logarithmic manner will require magnitudes to be modified via Equation 9-5 as discussed in Annex F, paragraph 9. The analyst will need to be cautious in addressing the amount of time compression during this process. Column K in the example spreadsheet provides a quick visual check of compression employed in development of the narrowband portion of the spectrum.
3.12
Ratio Check (Col. L) – If the ratio if Column K exceeds a user selected factor, a flag is set in column L warns the analyst. Annex F, paragraph 9 recommends a limit factor of 2.0 when considering ASD (g²/Hz) levels. In the event the ratio check indicates excessive scaling it may be helpful to divide the LVTS into multiple LVTS that each sweep over some portion of the full range. This will allow adjustment of the distribution of time into the separated ranges, but will increase the number of LVTS’s required to represent the LCEP of interest. There will generally be some level of engineering judgment required during this phase of a LVTS development. For example, following the guidance of not increasing the ASD levels via time compression techniques by more than 2:1 is still viable for the higher level narrowbands or at any frequency known to be critical to the payload or carrier vehicle. However, if a low amplitude harmonic not associated with a critical frequency exceeds the 2:1 criteria for a limited portion of a sweep one could consider making an exception. For cases in which time compression techniques of the narrowbands result in excessive deviation from the 2:1 criteria, the analyst may be required to break the LVTS into multiple LVTS developments in which a finer breakdown of the mission scenario is addressed (i.e., develop a low, medium, and high speed LVTS per axis). One should also use caution to ensure that the ratio is no less than 1:1 for the higher level narrowbands or at any frequency known to be critical to the payload or carrier vehicle.
3.3
Global ASD Error.
One of the most common frequency domain error metrics employed in TWR testing is based upon comparisons of ASD s computed over a given time segment. The level of non-stationarity of a reference signal and/or similarities in ' the data over a particular segment of time may be considered in selection of the time segment over which the ASD is computed. While it is certainly easy to argue the usefulness of an ASD estimate of non-stationary data, the technique is still useful in making a direct comparison between field based reference signals and laboratory-based data from a TWR test. A logical division of time segments is to select the segments to be as close to piecewise stationary as possible.
As previously stated, the topic of this document is centered on establishing global performance metrics for the MDOF
TWR scenario. The steps that follow outline one technique for consideration in viewing ASD results computed over multiple control channels.
Step 1 The arrays and ✓ shown in Equation 3.3.1 represent respectively, the N point sampled JxN JxN reference and laboratory data for each of the J control channels. Test-specific parameters such as sample frequency, Fs, and filter settings, should be tracked by the test operator. It is assumed that the time histories represented by Equation 3.3.1 will not have a bias, or that any bias has been removed during pre-processing.
(n) 4(n)` (n) ½₂(n) r(n) = l(n) = n = 1,2...N; (3.3.1) JxN 8 JxN r₁(n) 1, (n)
Step 2 The two matrices ASD _r, and ASD_1, shown in Equation 3.3.2 represent ASD estimates computed over time segment, s. The j index, j = 1,...J, represents the control channel number and
MIL-STD-810H METHOD
3.4
Global SRS Error.
As discussed in Method 525.2, significant transients that can be identified within a reference time trace may be analyzed post-test using traditional SRS or pseudo velocity SRS analysis. A global error technique for SRS analysis can be developed with a slight variation of the ASD approach defined in paragraph 3.3 above. Specifically, as a substitute for indexing on a frequency line basis, index frequency on a 1/12th octave basis using maxi-max acceleration within each 1/12th octave band.
MIL-STD-810H METHOD 527.2 ANNEX D