517.3-3 SLEW RATE CONTAMINATED DATA
These near-field data were recorded at a government facility that routinely conducts pyroshock testing. Triaxial accelerometer data were recorded during the firing of explosives located on a steel plate, but only the in-axis accelerometer data (data sensing the strongest response) are discussed and analyzed as per paragraph 6.1, references q and s. The raw in-axis accelerometer data are shown in Figure 517.3A-5 and appear to have the general characteristics of near-field pyroshock data. The data are very symmetrical visually. The integral of the accelerometer data is shown in Figure 517.3A-6 and indicates a velocity change that is inconsistent (and therefore erroneous) with a pyrotechnic test that has a zero velocity change.
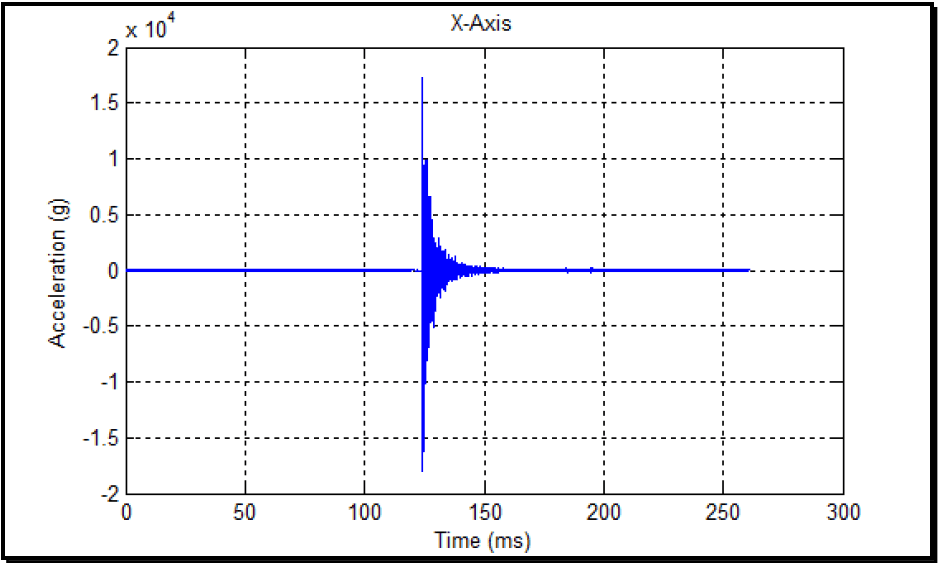
Figure description:
Acceleration vs. Time
X-Axis
| Time (ms) | Acceleration (g x 10^4) |
|---|---|
| 0 | 0.0 |
| 50 | 0.0 |
| 100 | 0.0 |
| 120 | 0.0 |
| 122 | 0.1 |
| 123 | 1.75 |
| 124 | -1.8 |
| 125 | 1.0 |
| 126 | -0.9 |
| 130 | 0.4 |
| 140 | 0.1 |
| 150 | 0.05 |
| 175 | 0.02 |
| 200 | 0.01 |
| 250 | 0.005 |
| 260 | 0.0 |
Notes: The chart shows a transient acceleration signal (likely a shock or vibration pulse along the X-axis. The y-axis values are scaled by 10,000. The signal remains at zero until approximately 122 ms, where a high-magnitude oscillation occurs, peaking at approximately 1.75 x 10^4 g and -1.8 x 10^4 g, before rapidly decaying to near-zero by 260 ms.)
Figure 517.3A-5. A near-field pyroshock acceleration time history.
MIL-STD-810H METHOD 517.3 ANNEX A
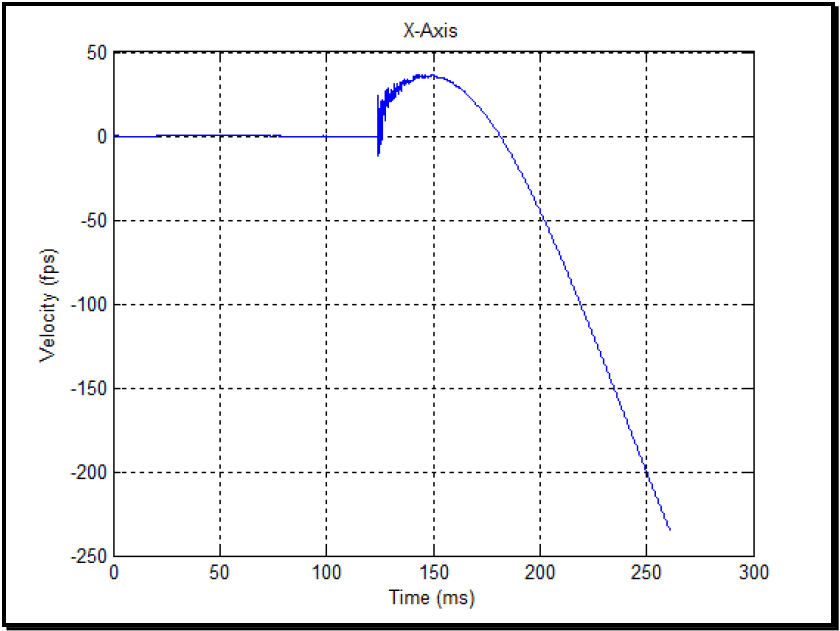
Figure description:
Velocity over Time (X-Axis
X-Axis
| Time (ms) | Velocity (fps) |
|---|---|
| 0 | 0.0 |
| 25 | 0.0 |
| 50 | 0.0 |
| 75 | 0.0 |
| 100 | 0.0 |
| 123 | 0.0 |
| 125 | -10.0 (noisy spike) |
| 126 | 25.0 (noisy spike) |
| 130 | 28.0 |
| 140 | 34.0 |
| 145 | 36.0 |
| 150 | 36.0 |
| 160 | 30.0 |
| 170 | 20.0 |
| 184 | 0.0 |
| 190 | -15.0 |
| 200 | -45.0 |
| 210 | -75.0 |
| 220 | -108.0 |
| 230 | -142.0 |
| 240 | -176.0 |
| 250 | -210.0 |
| 260 | -245.0 |
Notes: The data shows a system at rest until approximately 124ms, followed by a sharp noisy impulse and then a parabolic descent representing acceleration in the negative direction.
Figure 517.3A-6. The integral of the acceleration data in Figure 517.3A-5.
There is significant frequency content above 10,000 Hz at magnitudes above 10,000 g as evidenced by the discrete Fourier transform (DFT) in Figure 517.3A-7 and the shock response spectrum (SRS) in Figure 517.3A-8. The data were taken with hardware frequently used for pyroshock: a piezoelectric (PE) accelerometer with an internal mechanical low-pass filter and an internal electrical low-pass filter, a signal conditioner with 20,000 Hz cutoff frequency, a 4-pole Butterworth, low-pass "anti-aliasing" filter, and a data acquisition system (DAS) with sigma-delta architecture. Both the accelerometer and the signal conditioner are manufactured by the same company, and the DAS is manufactured by a second company. It is clear from DAS specifications that the anti-aliasing is inadequate, Figure 517.3A-7 shows that the roll-off of the data is not 60 dB/octave or 10 decade/decade slope on a log-log plot as per paragraph 6.1, references b, d, and f and indicates that aliasing is possible. In this case, the problems with the SRS start substantially above 100 Hz as shown in Figure 517.3A-8. A wavelet analysis was performed on these data as per paragraph 6.1, reference q, and the erroneous part of the data removed with this analysis is shown in Figure 517.3A- 9 that has a magnitude of +800/-500 g or about 4% of the amplitude in Figure 517.3A-5 and has a highly oscillatory time history that is the response to the combined environment of pyroshock acceleration and noise by either the signal conditioner, the associated DAS, or both. The two characteristics of slew-rate problems are present in Figure 517.3A- 9: low-frequency modulation (800 Hz as shown in the SRS) and an offset. A direct comparison of the two SRS for Figure 517.3A-5 and Figure 517.3A-9 is made in Figure 517.3A-10, and the curves directly overlay each other up to a frequency of 800 Hz, depicting the low-frequency contamination. Also, Figure 517.3A-12 shows that the upper- frequency limit of the wavelet correction is 800 Hz and does not change the high-frequency content above 800 Hz that is crucial to creating an accurate pyroshock specification from the SRS. What was assumed to be a structural response in the original SRS of Figure 517.3A-8 is now revealed as a DAS slew rate limitation.
SRS comparison of the erroneous data and the original data are in Figure 517.3A-10 and show the contaminated data are the cause for the erroneous SRS in Figure 517.3A-8. The contamination occurs at a frequency of 800 Hz and below. However, if just the high frequency positive and negative shock response spectra are examined, then the data looks reasonable. Figure 517.3A-11 has an SRS calculated with the corrected acceleration time history, and the results are consistent with near-field pyroshock. The SRS in Figure 517.3A-11 can now be used to create a specification with
MIL-STD-810H METHOD
3.1 Pretest
The following information is required to adequately conduct a pyroshock test.
- a. General. Information listed in Part One, paragraphs 5.7 and 5.9, and Part One, Annex A, Task 405 of this Standard.
- b. Specific to this Method.
- (1) Test system (test item/platform configuration) detailed configuration including:
- (a) Location of the pyrotechnic device.
- (b) Location of the materiel.
- (c) The structural path between the pyrotechnic device and the materiel, and any general coupling configuration of the pyrotechnic device to the platform, and the platform to the materiel including the identification of structural joints.
(d) Distance of the closest part of the materiel to the pyrotechnic shock device.
- (2) Pyroshock environment, including:
- (a) Type of pyrotechnic device.
- (b) If charge-related - size of pyrotechnic device charge.
MIL-STD-810H
METHOD 517.3
- (c) If charge effect - stored strain energy in primary device.
- (d) Means of initiation of the pyrotechnic device.
- (e) Anticipated EMI or thermal effects.
- (3) Effective duration of pyroshock if Procedure III, IV, or V is used, or the size and distribution of the pyrotechnic charge if Procedure I or II is used.
- (4) General materiel configuration including measurement points on or near the materiel.
- c. Tailoring. Necessary variations in the basic test procedures to accommodate LCEP requirements and/or facility limitations.
3.2 During Test
Collect the following information while conducting the test:
- a. General. Information listed in Part One, paragraph 5.10, and in Part One, Annex A, Tasks 405 and 406 of this Standard.
- b. Specific to this Method.
- (1) A means of assessing any damage to fixture/materiel configurations before continuing the tests. This includes test setup photos, test logs, and plots of actual shock transients. For shock-isolated assemblies within the test item, make measurements and/or inspections to ensure these assemblies did attenuate the pyroshock.
- (2) A record of previous shock time history information for analysis.
- (3) An SRS analysis capability to determine if specified pyroshock levels are being replicated.
3.3 Post-Test
The following post test data shall be included in the test report:
- a. General. Information listed in Part One, paragraph 5.13; and in Annex A, Task 406 of this Standard.
- b. Specific to this Method.
- (1) Duration of each exposure as recorded by the instrumented test fixture or test item, and the number of specific exposures.
- (2) Any data measurement anomalies, e.g., high instrumentation noise levels, loss of sensors or sensor mount as a result of testing, etc.
- (3) Status of the test item/fixture after each test.
- (4) Status of measurement system after each test.
- (5) Any deviations from the original test plan.