It is convenient to consider critical stress-intensity factor values, varying with thickness or stress state, as indices of crack-damage resistance. The stress-intensity factor can be used as a consistent measure of crack damage, not only for fracture instability, but also for other levels of crack damage severity, provided the damage is consistently specified and detected. This concept implies that plane-stress and transitional-fracture toughness of metallic materials, while not necessarily a fixed value for the material, is a characteristic value for a given product form, thickness, grain direction, temperature, and strain rate.
MIL-HDBK-5J
9.2.3.5.3 (b). Middle tension panel
The crack-tip plasticity and slow-stable growth of the crack which are attendant to plane-stress or transitional stress state conditions may cause a deviation from abrupt fracture which is normally associated with crack extension under ideal plane conditions, as illustrated in Figure 9.2.3.5.3(c).
MIL-HDBK-5J
31 January 2003
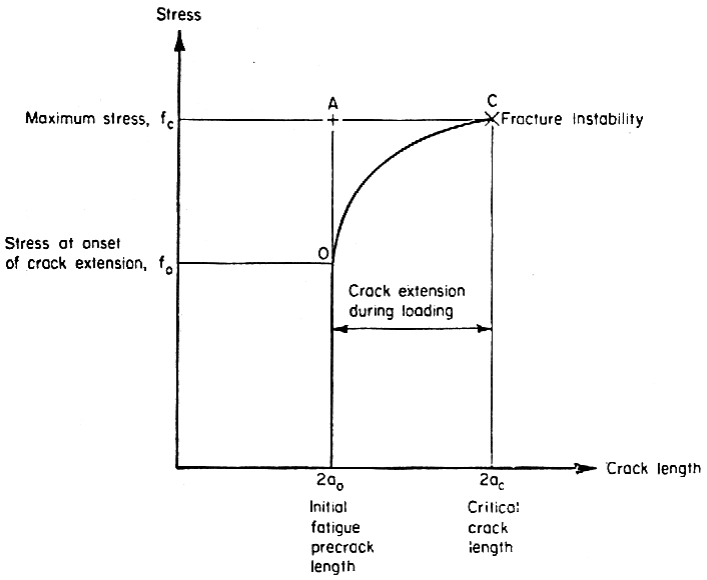
Figure description:
Mechanical Stress vs. Crack Length Relationship
Stress vs. Crack length
Annotations
- Maximum stress, (horizontal_line - position: y = )
- Stress at onset of crack extension, (horizontal_line - position: y = )
- Initial fatigue precrack length (text_label - position: x = )
- Critical crack length (text_label - position: x = )
- Crack extension during loading (text_label - position: Region/Curve between and )
- Fracture Instability (text_label - position: Point C at (), )
| Point | Crack length | Stress | Description |
|---|---|---|---|
| O | Onset of crack extension | ||
| A | Intersection of initial length and maximum stress | ||
| C | Fracture Instability / Maximum stress |
Notes: The graph depicts the relationship between applied stress and crack length. It highlights the stable crack extension phase that occurs during loading from an initial precrack length () until a critical length () is reached at the maximum stress (), leading to fracture instability.
Figure 9.2.3.5.3(c). Crack growth curve.
Two limiting damage levels are noted in this figure. Point O is the threshold or onset of slow, stable tear where the crack slowly extends after reaching a threshold stress level. Point C is fracture instability. Both levels of crack damage can be associated with a different stress intensity factor, or damage index, for product forms and thicknesses of interest. These damage levels can be identified either directly with the K value as determined from instantaneous stress-crack length coordinate dimensions at these points, or approximately by the coordinates of Point A, which is residual strength, or apparent toughness concept of relating initial crack length to final fracture stress.
The stress intensity factor, K, associated with any of these damage levels is determined from
K = f , ksi [9.2.3.5.3(a)]
where, for this configuration, a: half-length of middle crack Y: .
The locus of data points can be represented by a parametric stress-intensity factor curve, as shown in Figure 9.2.3.5.3(d), where each curve represents a different stress-intensity factor formulation. The slow growth