| Specification | AMS-T-9046 | AMS 4902 and AMS-T- 9046 | AMS 4900 and AMS-T- 9046 | AMS 4901 and AMS-T- 9046 | AMS 4921 and MIL-T- 9047 | MIL-T- 9047a |
|---|---|---|---|---|---|---|
| Designation | CP-4 | CP-3 | CP-2 | CP-1 | CP-70 | |
| Form | Sheet, strip, and plate | Bar | ||||
| Condition | Annealed | Annealed | ||||
| Thickness or diameter, in. | ≤1.000 | <2.999b | 3.000- 4.000b | |||
| Basis | S | S | S | S | S | S |
| Mechanical Properties: | ||||||
| Ftu, ksi: | ||||||
| L | 35 | 50 | 65 | 80 | 80 | 80 |
| LT | 35 | 50 | 65 | 80 | 80c | 80 |
| ST | … | … | … | … | … | 80 |
| Fy, ksi: | ||||||
| L | 25 | 40 | 55 | 70 | 70 | 70 |
| LT | 25 | 40 | 55 | 70 | 70c | 70 |
| ST | … | … | … | … | … | 70 |
| Fcy, ksi: | ||||||
| L | … | … | … | 70 | … | … |
| LT | … | … | … | 70 | … | … |
| Fsu, ksi | … | … | … | 42 | … | … |
| Fbru, ksi: | ||||||
| (e/D = 1.5) | … | … | … | 120 | … | … |
| (e/D = 2.0) | … | … | … | … | … | … |
| Fbry, ksi: | ||||||
| (e/D = 1.5) | … | … | … | 101 | … | … |
| (e/D = 2.0) | … | … | … | … | … | … |
| e, percent: | ||||||
| L | 24d | 20d | 18d | 15d | 15 | 15 |
| LT | 24d | 20d | 18d | 15d | 15c | 15 |
| ST | … | … | … | … | … | 15 |
| RA, percent: | ||||||
| L | … | … | … | … | 30 | 30 |
| LT | … | … | … | … | 30c | 30 |
| ST | … | … | … | … | … | 30 |
| E, 103 ksi | … | … | … | 15.5 | … | … |
| Ec, 103 ksi | … | … | 16.0 | … | … | … |
| G, 103 ksi | … | … | … | 6.5 | … | … |
| μ | … | … | … | … | … | … |
| Physical Properties: | ||||||
| ω, lb/in.3 | 0.163 | |||||
| C, K, and α | See Figure 5.2.1.0 | |||||
MIL-HDBK-5J
5.2.1.0 (c). Design Mechanical and Physical Properties of Commercially Pure Titanium Extruded Bars and Shapes
| Specification… | AMS-T-81556 | |||
|---|---|---|---|---|
| Comp. CP-4 | Comp. CP-3 | Comp. CP-2 | Comp. CP-1 | |
| Form… | Extruded bars and shapes | |||
| Condition… | Annealed | |||
| Thickness or diameter, in.… | 0.188-3.000 | |||
| Basis… | S | S | S | S |
| Mechanical Properties: | ||||
| Ftu, ksi: | ||||
| L | 40 | 50 | 65 | 80 |
| LT… | … | … | … | … |
| Fty, ksi: | ||||
| L | 30 | 40 | 55 | 70 |
| LT… | … | … | … | … |
| Fcy, ksi: | ||||
| L | … | … | … | … |
| LT… | … | … | … | … |
| Fs, ksi | ||||
| Fbru, ksi: | ||||
| (e/D = 1.5) | … | … | … | … |
| (e/D = 2.0) | … | … | … | … |
| Fbry, ksi: | ||||
| (e/D = 1.5) | … | … | … | … |
| (e/D = 2.0) | … | … | … | … |
| e, percent: | ||||
| L | a | a | a | a |
| E, 103 ksi | 15.5 | |||
| Ec, 103 ksi | 16.0 | |||
| G, 103 ksi | 6.5 | |||
| μ… | … | |||
| Physical Properties: | ||||
| ω, lb/in.3 | 0.163 | |||
| C, K, and α… | See Figure 5.2.1.0 | |||
a Elongation in percent as follows:
| Thickness, inches | Comp. CP-4 | Comp. CP-3 | Comp. CP-2 | Comp. CP-1 |
|---|---|---|---|---|
| 0.188-1.000 | 25 | 20 | 18 | 15 |
| 1.001-2.000 | 20 | 18 | 15 | 12 |
| 2.001-3.000 | 18 | 15 | 12 | 10 |
MIH-HDBK MIL-HDBK-31 January 20
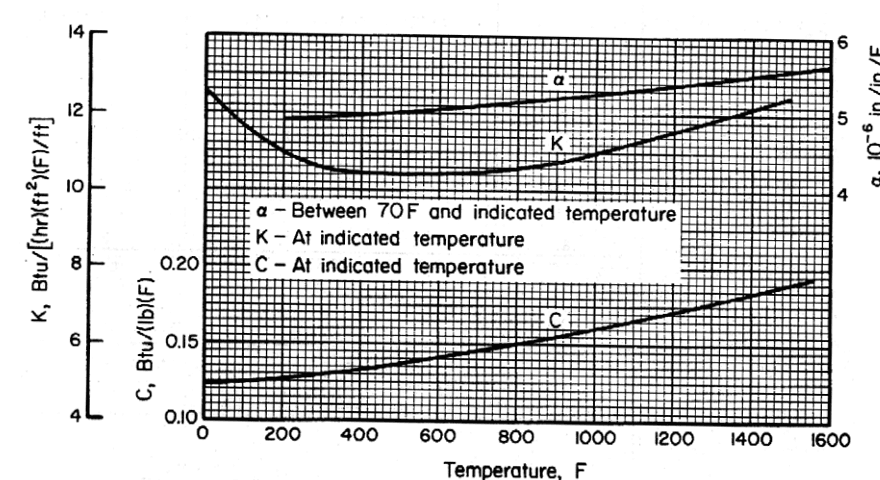
Figure description:
Material Properties Temperature Dependence
Properties of Material vs. Temperature
Legend
- a - Between 70 F and indicated temperature — color: black; symbol: Solid line
- K - At indicated temperature — color: black; symbol: Solid line
- C - At indicated temperature — color: black; symbol: Solid line
| Temperature (F) | K, Btu/[(hr(ft^2(F/ft))) | C, Btu/(lb(F)) | alpha, 10^-6 in/in/F |
|---|---|---|---|
| 0 | 12.5 | 0.125 | null |
| 200 | 11.2 | 0.125 | 4.75 |
| 400 | 10.5 | 0.130 | 4.80 |
| 600 | 10.35 | 0.138 | 4.89 |
| 800 | 10.45 | 0.147 | 5.00 |
| 1000 | 10.8 | 0.158 | 5.12 |
| 1200 | 11.3 | 0.170 | 5.25 |
| 1400 | 11.9 | 0.182 | 5.38 |
| 1500 | 12.3 | 0.189 | 5.45 |
| 1600 | null | 0.196 | 5.52 |
Notes: The graph presents three material properties across a temperature range of 0 to 1600 degrees Fahrenheit. Thermal conductivity (K is read on the outermost left y-axis, specific heat (C on the inner left y-axis, and the coefficient of thermal expansion (alpha on the right y-axis. The data indicates that K reaches a minimum around 600 F before increasing, while C and alpha increase steadily with temperature. The alpha curve starts at 200 F, and the K curve ends at 1500 F.)))
Temperature, F Figure 5.2.1.0. Effect of temperature on the physical properties of commercially pure titanium.