| Specification | AMS 5608 | |
|---|---|---|
| Form | Sheet | |
| Condition | Solution Treated | |
| Thickness, in. | <0.020 | 0.020-0.187 |
| Basis | S | S |
| Mechanical Properties: | ||
| Ftu, ksi: | ||
| L | 125 | 125 |
| LT | 125 | 125 |
| Fty, ksi: | ||
| L | 57 | 57 |
| LT | 55 | 55 |
| Fcy, ksi: | ||
| L | ||
| LT | 55 | 55 |
| Fsu, ksi: | 111 | 111 |
| Fbru, ksi: | ||
| (e/D = 1.5) | ||
| (e/D = 2.0) | ||
| Fbry, ksi: | ||
| (e/D = 1.5) | ||
| (e/D = 2.0) | ||
| e, percent: | ||
| LT | 40 | 45 |
| E, 10³ ksi | 33.6 | |
| Ec, 10³ ksi | 33.6 | |
| G, 10³ ksi | 12.8 | |
| μ | 0.31 | |
| Physical Properties: | ||
| ω, lb/in.³ | 0.324 | |
| C, K, and α | See Figure 6.4.2.0 | |
from https://
MIL-HDBK-5J
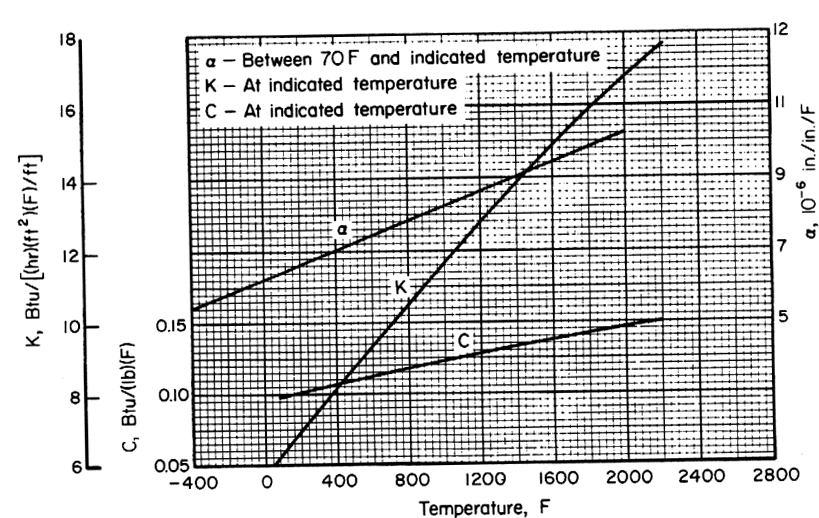
Figure description:
Material Properties vs. Temperature
Material Properties vs. Temperature
Legend
- ̑ - Between 70 F and indicated temperature — color: black; symbol: Solid line
- K - At indicated temperature — color: black; symbol: Solid line
- C - At indicated temperature — color: black; symbol: Solid line
Annotations
- ̑ (text_label - position: Near the line for ̑ at Temperature ≈ 400)
- K (text_label - position: Near the line for K at Temperature ≈ 800)
- C (text_label - position: Near the line for C at Temperature ≈ 1200)
| Temperature (F) | ̑ (10⁻⁶ in./in./F) | K (Btu/[(hr(ft²(F/ft)))) | C (Btu/(lb(F))) |
|---|---|---|---|
| -400 | 5.3 | null | null |
| -200 | 5.6 | null | null |
| 0 | 6.0 | null | null |
| 100 | 6.2 | 6.0 | 0.100 |
| 200 | 6.4 | 6.7 | 0.103 |
| 400 | 6.8 | 8.0 | 0.108 |
| 600 | 7.2 | 9.3 | 0.113 |
| 800 | 7.5 | 10.6 | 0.118 |
| 1000 | 7.9 | 11.9 | 0.123 |
| 1200 | 8.3 | 13.2 | 0.128 |
| 1400 | 8.7 | 14.5 | 0.133 |
| 1600 | 9.0 | 15.8 | 0.138 |
| 1800 | 9.4 | 17.1 | 0.143 |
| 2000 | 9.8 | 18.4 | 0.148 |
| 2200 | 10.2 | null | 0.153 |
Notes: The chart features multiple Y-axes: ̑ is on the right axis, K is on the outermost left axis, and C is on the inner left axis. Data values are estimated based on the provided grid.
Temperature, F
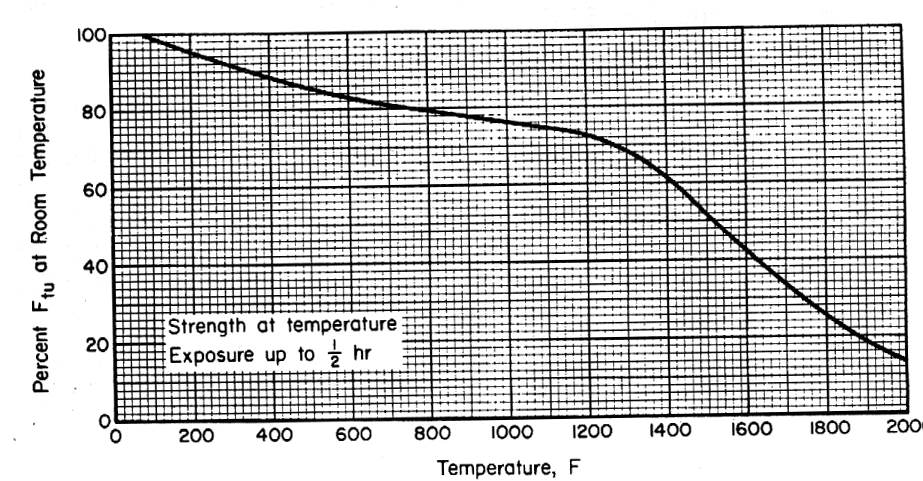
Figure description:
Material Strength at Elevated Temperatures Percentage of Room Temperature Ftu vs. Temperature
Strength at temperature
Annotations
- Strength at temperature Exposure up to 1/2 hr (text_label - position: x=200 to 800, y=20 to 30)
| Temperature (F) | Percent F_tu at Room Temperature |
|---|---|
| 0 | 100.0 |
| 100 | 97.5 |
| 200 | 95.0 |
| 300 | 92.5 |
| 400 | 90.0 |
| 500 | 87.5 |
| 600 | 85.0 |
| 700 | 82.5 |
| 800 | 80.0 |
| 900 | 78.5 |
| 1000 | 77.0 |
| 1100 | 75.5 |
| 1200 | 73.0 |
| 1300 | 68.0 |
| 1400 | 62.0 |
| 1500 | 52.0 |
| 1600 | 42.0 |
| 1700 | 33.0 |
| 1800 | 26.0 |
| 1900 | 20.0 |
| 2000 | 15.0 |
Notes: The chart illustrates the reduction in the ultimate tensile strength (Ftu of a material as a percentage of its room temperature value when exposed to elevated temperatures up to 2000 degrees Fahrenheit for a duration of up to 30 minutes.)
Figure 6.4.2.1.1(a). Effect of temperature on tensile ultimate strength (Ftu) of HS 18 sheet.