9.8.4.1
Typical Stress-Strain — The stress-strain and tangent-modulus data appearing in MIL-HDBK-5 are described as “typical” stress-strain and compression tangent-modulus curves. The term typical indicates that representative stress-strain data for products covered have been adjusted to reflect precision typical values of the elastic modulus, and product average values of the 0.2 percent offset yield strength in tension or compression. Curves extend to strain somewhat beyond the 0.2 percent offset yield strength. Curves described as “full range” stress-strain curves are also included in MIL-HDBK-5. These curves extend through maximum load and beyond to rupture. Mathematical representations of curves are covered in Section 9.8.4.6.
All curves will be prominently marked “typical”. With regard to tension data, only stress-strain curves are shown; however, compression data should include stress-strain curves and tangent-modulus curves. The Ramberg-Osgood n exponent should appear on all stress-strain curves if n is shown to apply in the approximate range from proportional limit to yield strength. The procedures and methods to be used are described in the following paragraphs.
Two alternative procedures are described for determining typical stress-strain curves.
- (1) The "strain-departure" method, which assumes no parametric relationship between stress and plastic strain, utilizes the full stress-strain curve.
- (2) The Ramberg-Osgood method, which assumes an exponential relationship between stress and plastic strain. Its use requires as few as two points from the original stress-strain curve, once the exponential relationship has been found to be applicable.
Generally, the two methods yield nearly identical results for those portions of the curve lying between proportional limit and yield stress. For plastic strains greater than about 0.002 in./in. and for bimetallic or clad products, only the strain-departure method is applicable.
Stress tangent-modulus curves may be derived graphically from compressive stress-strain curves, or computed, if the Ramberg-Osgood method is used.
9.8.4.1.1
Strain Departure Method — These steps, as illustrated in Table 9.8.4.1.1, should be followed to establish a typical tensile or compressive stress-strain curve using the strain-departure method:
MIL-HDBK-5J
9.8.4.1.2
Ramberg-Osgood Method — This method, which is based on the work of Ramberg and Osgood [Reference 9.8.4.1.2(a)], and Hill [Reference 9.8.4.1.2(b)], assumes that an exponential relationship exists between stress and plastic strain, as expressed by
= 0.002 [9.8.4.1.2(a)]
where
f is stress,
is the 0.2 percent yield stress,
is plastic strain,
n is the Ramberg-Osgood parameter**.
While this relationship may not be exact, it is sufficiently accurate for use up to the yield strength for many materials, but cannot be employed to compute full-range stress-strain curves.
Since total strain equals elastic strain plus plastic strain,
[9.8.4.1.2(b)]
where E is the typical value of modulus of elasticity from the room-temperature property tables.
Equation 9.8.4.1.2(b) can be programmed for determination and plotting by a computer, given only values for E, n, and . To obtain typical curves, TYS or CYS is used for . TYS and CYS values are based on product averages when available; in other cases, average values from original stress-strain curves are used. The Ramberg-Osgood parameter, n, will be determined analytically in development of typical stress-strain curves for MIL-HDBK-5.
As the first step in the analytical determination of n, a series of values of stress and strain departure (plastic strain) must be obtained from each original stress-strain curve. These may be determined by the method of strain-departure described in Section 9.8.4.1.1 or the alternate method outlined below:
- (1) Determine the indicated modulus of elasticity for the individual stress-strain curves.
- (2) For each curve, construct two lines parallel to the modulus line and intersecting the stress-strain curve at plastic strains of approximately 0.020 and 0.20 percent. The lines will bound the zone where stress-plastic strain pairs are determined. This zone also eliminates the small plastic strain region where nonlinearities in stress versus plastic strain sometimes exist.
- (3) Digitize each stress-strain curve over the range bounded in Step 2. A series of approximately ten to 12 pairs of stress-total pairs should be taken at nearly equal intervals within this range. A resolution of 0.25 ksi stress and 0.01 percent strain is desirable here.
- (4) Compute plastic strains from each collection of total strains, using the individual curve’s modulus to subtract out elastic strains.
MIL-HDBK-5J
9.8.4.2
Compression-Tangent-Modulus Curves — In deriving tangent-modulus curves graphically from typical compressive stress-strain curves, a number of points are marked off on the latter curves, particularly where the curve departs from linearity and in regions of greatest curvature. At each point on the curve, a line is drawn tangent to the curve as shown in Figure 9.8.4.2(a). The slope of each line is the tangent modulus corresponding to the stress coordinate of the point of tangency. The Ramberg-Osgood relationship, Equation 9.8.4.2(b),
etotal = f/E + 0.002 (f/f0.2ys)n [9.8.4.2(a)]
also may be employed to determine the compression tangent-modulus curve.
Tangent modulus is the first derivative of stress with respect to strain, df/de, or

Figure description:
Equation for Tangent Modulus (:
Reference Identifier: [9.8.4.2(b
Key Entities:
- : Tangent modulus.
- : Young's modulus (modulus of elasticity.
- : Stress.
- : 0.2% offset yield strength (average CYS for typical curves.
- : Strain hardening exponent/Ramberg-Osgood parameter.
This equation can be programmed for determination and plotting by a computer, given only values for E, n, and f0.2%ys. To obtain typical curves, average CYs is used for f0.2%ys.
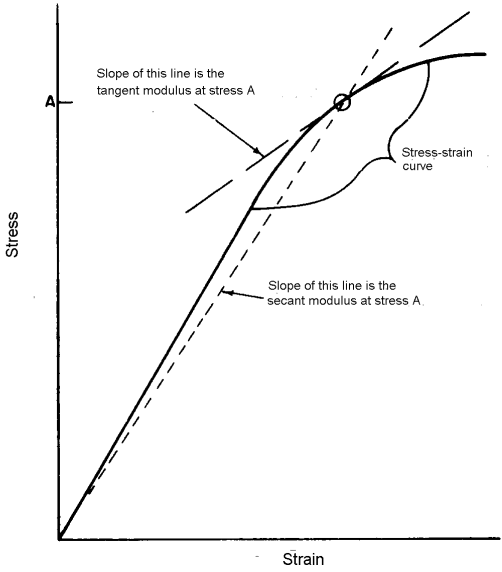
Figure description:
Moduli Definitions on a Stress-Strain Curve
Illustration of Tangent and Secant Moduli
Legend
- Stress-strain curve — color: black; symbol: Thick solid line
- Tangent modulus line — color: black; symbol: Thin solid line
- Secant modulus line — color: black; symbol: Dashed line
Annotations
- A (text_label - position: y-axis intercept representing stress level A)
- Slope of this line is the tangent modulus at stress A (text_label - position: Pointing to the thin solid line tangent to the curve at stress A)
- Slope of this line is the secant modulus at stress A (text_label - position: Pointing to the dashed line originating from (0,0 and passing through the curve at stress A))
- Stress-strain curve (text_label - position: Pointing to the main thick solid curve)
- Point of intersection at stress A (marker - position: Point on curve corresponding to stress level A, marked with a circle)
| Strain (Relative Scale) | Stress-strain curve (Stress) | Secant modulus line (Stress) | Tangent modulus line (Stress) |
|---|---|---|---|
| 0 | 0.0 | 0.0 | null |
| 10 | 16.0 | 13.3 | null |
| 20 | 32.0 | 26.7 | 52.0 |
| 30 | 47.0 | 40.0 | 59.0 |
| 40 | 60.0 | 53.3 | 66.0 |
| 50 | 71.0 | 66.7 | 73.0 |
| 60 | 80.0 | 80.0 | 80.0 |
| 70 | 87.0 | null | 87.0 |
| 80 | 92.0 | null | 94.0 |
| 90 | 96.0 | null | 101.0 |
| 100 | 98.0 | null | 108.0 |
Notes: The graph depicts a typical non-linear stress-strain relationship. The tangent modulus at a specific stress 'A' is defined by the slope of the line tangent to the curve at that point. The secant modulus is defined by the slope of a line connecting the origin to that same point on the curve. Numerical values in the table are estimated based on the visual proportions of the diagram.
Figure 9.8.4.2(a). Determining tangent modulus and secant modulus.
MIL-HDBK-5J
9.8.4.3
Full-Range Tensile Stress-Strain Curves — Preparation of each typical full-range tensile stress-strain curve requires (1) representative original full-range stress-strain curves, (2) product average values for ultimate strength, yield strength, and elongation, and (3) typical precision elastic-modulus values at test temperature. Full-range tensile stress-strain data for at least one lot of material will be provided, but data from three lots are preferred. If data for less than three lots are submitted, the full-range stress-strain curve will be labeled “BASED ON ONE LOT” or “BASED ON TWO LOTS”, as appropriate.
The procedure for developing typical full-range tensile stress-strain curves is based upon strain departures obtained from several original test curves, and the product average tensile strength, yield strength, and elongation established from production data. Properties of material tested for determining strain departures should be in reasonable agreement with the product average properties.
These steps, as illustrated in Table 9.8.4.3 and Figures 9.8.4.3(a) and (b), should be followed in developing typical full-range tensile stress-strain curves.
- (1) From each stress-strain test curve, measure strain departures (D) between the extension of the modulus line and the curve at stresses determined by taking appropriate percentages of the differences between ultimate stress and yield stress added to the yield stress.
(TUS - TYS)
where TUS and TYS are values for each test. Also identify the proportional limit for each test. The proportional limit is defined as the stress level below, which the stress-strain curve is linear; as determined by where is the stress, E is Young's Modulus, and is the strain.
a b c d e f g h i j k l
| Percent | Test 1 | Test 2 | Average | Typical | ||||||
|---|---|---|---|---|---|---|---|---|---|---|
| Stress, ksi σ₁ | Strain Departureᵊ in./in. (D₁) | Stress, ksi σ₂ | Strain Departureᵊ in./in. (D₂) | Stress, ksi σA | Strain Departureᵋ in./in. (DA) | Stress, ksi σT | Strain Departureᵌ in./in. (DT) | Elastic Strainᵍ in./in. (εe) | Total Strainᵒ in./in. (εt) | |
| Yield Stress to Ultimate Stress | ||||||||||
| Proportional Limit (PL) | 56.5 | 58.5 | 57.5ᵏ | 59.6ᵌ | 0.0000 | 0.0058 | 0.0058 | |||
| 0(TYS) | 58.8ᵈ | 0.0020 | 60.9ᵈ | 0.0020 | 59.8 | 0.0020 | 62.0ᵌ | 0.0020 | 0.0061 | 0.0081 |
| 20 | 61.0ᵈ | 0.0106 | 63.0ᵈ | 0.0094 | 62.0 | 0.0100 | 64.0ᵌ | 0.0100 | 0.0063 | 0.0163 |
| 40 | 63.2ᵈ | 0.0204 | 65.2ᵈ | 0.0194 | 64.2 | 0.0199 | 66.0ᵌ | 0.0200 | 0.0065 | 0.0265 |
| 60 | 65.4ᵈ | 0.0302 | 67.4ᵈ | 0.0302 | 66.4 | 0.0302 | 68.0ᵌ | 0.0303 | 0.0067 | 0.0370 |
| 80 | 67.7ᵈ | 0.0452 | 69.5ᵈ | 0.0436 | 68.6 | 0.0444 | 70.0ᵌ | 0.0446 | 0.0069 | 0.0515 |
| 95 | 69.3ᵈ | 0.0640 | 71.1ᵈ | 0.0626 | 70.2 | 0.0633 | 71.5ᵌ | 0.0636 | 0.0070 | 0.0706 |
| 100(TUS) | 69.9ᵈ | 0.0848 | 71.7ᵈ | 0.0838 | 70.8 | 0.0843 | 72.0ᵌ | 0.0847 | 0.0071 | 0.0918 |
| Ultimate Stress to Fracture Stress (FS) | ||||||||||
| 100(TUS) | 69.9ᵉ | 0.0848 | 71.7ᵉ | 0.0838 | 70.8 | 0.0843 | 72.0ᵍ | 0.0847 | 0.0071 | 0.0918 |
| 90 | 69.0ᵉ | 0.0962 | 70.9ᵉ | 0.1014 | 70.0 | 0.0988 | 71.1ᵎ | 0.0992 | 0.0070 | 0.1062 |
| 60 | 66.3ᵉ | 0.1058 | 68.5ᵉ | 0.1156 | 67.4 | 0.1107 | 68.5ᵎ | 0.1112 | 0.0067 | 0.1179 |
| 0(FS) | 60.9ᵉ | 0.1210 | 63.7ᵉ | 0.1378 | 62.3 | 0.1294 | 63.4ᵏ | 0.1300 (Elong.) | 0.0062 | 0.1362 |
- \alpha \})]+\alpha
- 8 4 6 8
e va
5_T(F
- 0.
- FS)) 002
- d Averages (o and D) of Tests 1 and 2.
- e OT=TYSProd. Avg. +% (TUS Prod. Avg. - TYSProd. Avg.).
- f σ+(FS) = (TUS Prod. Avg./TUS Avg.) Avg. (FS).
- ch to
- h Average proportional limit.
- i D₁ = [((DA - 0.002) x (Product Average Elongation -0.002)) ÷ (DA at FS - 0.002)] + 0.002.
- j &E =σTE (E=10.2 x 10³ ksi in this example).
- k &T=DT+ &E
- 1 GT (PL)=(TYSProd. Avg TYS Avg.) Avg. (PL).
MIL-HDBK-5J
9.8.4.4
Minimum Stress-Strain and Stress Tangent-Modulus Curves — Minimum stress-strain and stress tangent-modulus curves are not presented in MIL-HDBK-5, but these are sometimes required by the designer. Procedures for preparing minimum curves are identical to those for preparing typical curves, except for choice of yield-strength values. Product average, or average values of yield strength, are used to determine typical curves; minimum values ( or , A- or B-basis) are used to determine minimum curves. Average values of precision elastic modulus ( or ) are used.
9.8.4.5
Biaxial Stress-Strain Behavior — Procedures for analyzing and presenting biaxial stress-strain properties may be added to the guidelines at a later date. In the interim, procedures described in Reference 9.8.4.5 may be used as a general guide.
9.8.4.6
Mathematical Representation of Stress-Strain Curves — As an aid to computer analyses, the stress-strain curves for most materials can be represented mathematically. This method of representing stress-strain curves may be used for any stress-strain response that can be well characterized by the Ramberg-Osgood Method, and should be used as a supplement to a curve drawn by the Ramberg-Osgood Method.
To represent the stress-strain curves for a particular alloy using this method, a data summary like the one shown in Figure 9.8.4.6 should be constructed.
MIL-HDBK-5J
9.8.4.6.1
Proportional Limit Stress in Tension and Compression — If the proportional limit stress is equated with a plastic strain level of 0.0002 or a 0.02 percent deviation from linearity, and the Ramberg-Osgood relationship is found to be valid for small plastic strains, then the proportional limit stress (f p.l.) can be approximated from Equation 9.8.4.6(a) as follows:
MIL-HDBK-5J
9.8.4.6.2
Shear Yield Stress — An estimate of the shear yield stress can be obtained from the equation:
F sy = [F ty(L) + F ty(LT) + F cy(L) + F cy(LT)] / 4 x [2F su] / [F tu(L) + F tu(LT)] [9.8.4.6.2]
where
| (p) | = | Primary load direction for shear |
| Fty(L) | = | Tensile yield stress, longitudinal direction |
| Fty(LT) | = | Tensile yield stress, long transverse direction |
| Fcy(L) | = | Compressive yield stress, longitudinal direction |
| Fcy(LT) | = | Compressive yield stress, long transverse direction |
| Fsu | = | Shear ultimate stress |
| Ftu(L) | = | Tensile ultimate stress, longitudinal direction |
| Ftu(LT) | = | Tensile ultimate stress, long transverse direction. |
9.8.4.6.3
Compression Tangent Modulus Curves — A mathematical procedure for construction of tangent modulus curves from compression stress-strain curves is given in Section 9.8.4.2. The compression stress-strain curve (up to the yield stress) may be constructed by adding the elastic strain component to the plastic strain component given in Equation 9.8.4.6(a). Calculation of the first derivative of stress with respect to strain gives tangent modulus values for specific values of total strain. Within MIL-HDBK-5 the tangent modulus curve is normally computed only up to the yield stress on the stress-strain curve. If tangent modulus values are desired at stress levels above the yield stress, a single function describing the relationship between stress and plastic strain over the range of interest should be used [rather than two separate functions as shown in Equations 9.8.4.6(a) and (b)].