The design procedure for the DuraFuse Frames connection results in fully restrained connections where the beams and columns remain essentially elastic during seismic events.
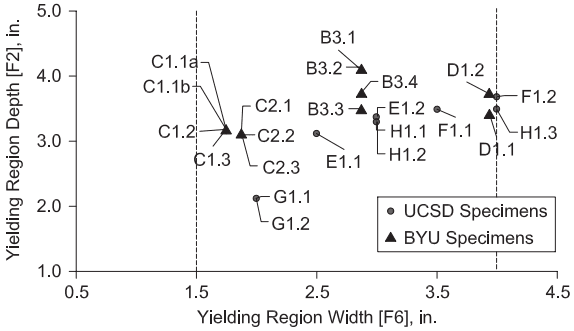
Figure description:
Specimen Yielding Region Comparison
Yielding Region Depth [F2, in. vs Yielding Region Width [F6, in.
Legend
- UCSD Specimens — color: dark grey; symbol: circle
- BYU Specimens — color: dark grey; symbol: triangle
Annotations
- x = 1.5 (vertical_line - position: x = 1.5)
- x = 4.0 (vertical_line - position: x = 4.0)
| Specimen Label | Specimen Type | Yielding Region Width [F6, in. | Yielding Region Depth [F2, in. |
|---|---|---|---|
| C1.1a | BYU Specimens | 1.75 | 3.2 |
| C1.1b | BYU Specimens | 1.75 | 3.2 |
| C1.2 | BYU Specimens | 1.75 | 3.2 |
| C1.3 | BYU Specimens | 1.75 | 3.2 |
| C2.1 | BYU Specimens | 1.9 | 3.1 |
| C2.2 | BYU Specimens | 1.9 | 3.1 |
| C2.3 | BYU Specimens | 1.9 | 3.1 |
| G1.1 | UCSD Specimens | 2.0 | 2.15 |
| G1.2 | UCSD Specimens | 2.0 | 2.15 |
| E1.1 | UCSD Specimens | 2.5 | 3.15 |
| B3.1 | BYU Specimens | 2.85 | 4.1 |
| B3.2 | BYU Specimens | 2.85 | 3.75 |
| B3.3 | BYU Specimens | 2.85 | 3.5 |
| B3.4 | BYU Specimens | 2.85 | 3.5 |
| E1.2 | UCSD Specimens | 3.0 | 3.4 |
| H1.1 | UCSD Specimens | 3.0 | 3.35 |
| H1.2 | UCSD Specimens | 3.0 | 3.3 |
| F1.1 | UCSD Specimens | 3.5 | 3.5 |
| D1.1 | BYU Specimens | 3.9 | 3.4 |
| D1.2 | BYU Specimens | 3.9 | 3.75 |
| F1.2 | UCSD Specimens | 4.0 | 3.7 |
| H1.3 | UCSD Specimens | 4.0 | 3.5 |
Notes: The specimen labels point to specific data points. Multiple labels sometimes point to the same geometric marker (e.g., C1.1a-C1.3 all point to the same triangle. The vertical dashed lines are markers at x = 1.5 and x = 4.0.)
Fig. C-15.1. Yielding region widths and depths that have been tested.
With the DuraFuse Frames connection, the maximum probable moment at the column face is governed by the geometry of the fuse plate. The dimensions of the yielding regions on the fuse plate, which are determined in the final steps of the design procedure, are selected so that when the fuse plate has yielded and fully strain-hardened, the moment at the face of the column, , will not exceed of the beam.
This approach differs from most other special moment frame connections where the plastic hinge capacity of the beam is determined first and then extrapolated to the column face. The procedure is different for the DuraFuse Frames connection because a plastic hinge never forms in the beam. The beam does not yield at the face of the column, even though the moment at the face of the column may reach , because the beam is reinforced by the top plates and fuse plates in the connection region.
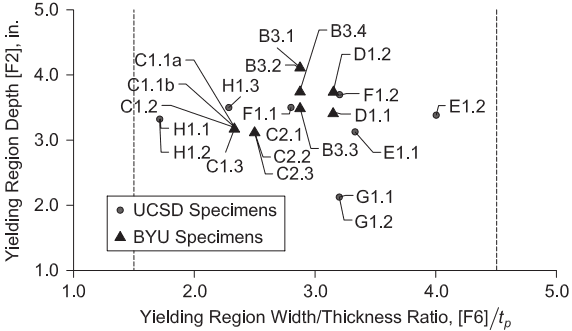
Figure description:
Yielding Region Dimensions
Yielding Region Depth vs. Yielding Region Width/Thickness Ratio
Legend
- UCSD Specimens — color: dark grey; symbol: circle
- BYU Specimens — color: dark grey; symbol: triangle
Annotations
- Lower limit bound (vertical_line - position: x = 1.5)
- Upper limit bound (vertical_line - position: x = 4.5)
| Specimen Label | Specimen Type | Yielding Region Width/Thickness Ratio, [F6/t_p | Yielding Region Depth [F2, in. |
|---|---|---|---|
| H1.1, H1.2 | UCSD Specimens | 1.6 | 3.33 |
| C1.1a, C1.1b, C1.2 | UCSD Specimens | 2.2 | 3.21 |
| C1.3 | BYU Specimens | 2.33 | 3.19 |
| H1.3 | UCSD Specimens | 2.3 | 3.52 |
| C2.1, C2.2, C2.3 | BYU Specimens | 2.5 | 3.14 |
| F1.1 | UCSD Specimens | 2.8 | 3.51 |
| B3.3 | BYU Specimens | 2.85 | 3.51 |
| B3.2 | BYU Specimens | 2.85 | 3.77 |
| B3.1, B3.4 | BYU Specimens | 2.85 | 4.14 |
| D1.2 | BYU Specimens | 3.15 | 3.77 |
| D1.1 | BYU Specimens | 3.15 | 3.42 |
| F1.2 | UCSD Specimens | 3.2 | 3.72 |
| G1.1, G1.2 | UCSD Specimens | 3.2 | 2.12 |
| E1.1 | UCSD Specimens | 3.35 | 3.12 |
| E1.2 | UCSD Specimens | 4.0 | 3.39 |
Notes: The chart displays individual and grouped specimens from UCSD and BYU. Several specimen labels share the same data point, as indicated by multiple leader lines pointing to single markers.
Fig. C-15.2. Yielding region width/thickness ratios that have been tested.
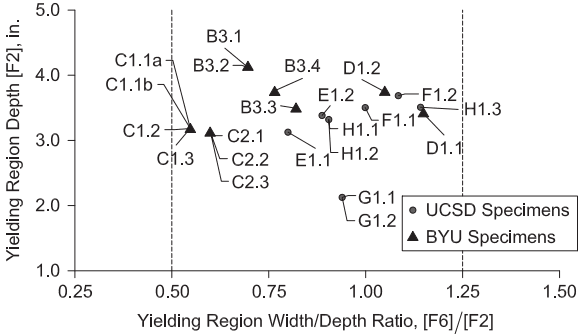
Figure description:
Yielding Region Depth vs. Width/Depth Ratio
Legend
- UCSD Specimens — color: gray; symbol: circle
- BYU Specimens — color: black; symbol: triangle
Annotations
- Reference boundary (vertical_line - position: x = 0.50)
- Reference boundary (vertical_line - position: x = 1.25)
| Specimen Label(s) | Type | Yielding Region Width/Depth Ratio, [F6/[F2 | Yielding Region Depth [F2, in. |
|---|---|---|---|
| C1.1a, C1.1b, C1.2, C1.3 | BYU Specimens | 0.54 | 3.18 |
| C2.1, C2.2, C2.3 | BYU Specimens | 0.60 | 3.12 |
| B3.1, B3.2 | BYU Specimens | 0.70 | 4.15 |
| B3.4 | BYU Specimens | 0.77 | 3.75 |
| B3.3 | BYU Specimens | 0.82 | 3.52 |
| D1.2 | BYU Specimens | 1.05 | 3.75 |
| D1.1 | BYU Specimens | 1.15 | 3.42 |
| H1.1, H1.2 | UCSD Specimens | 0.79 | 3.12 |
| E1.2 | UCSD Specimens | 0.88 | 3.40 |
| E1.1 | UCSD Specimens | 0.90 | 3.33 |
| G1.1, G1.2 | UCSD Specimens | 0.94 | 2.12 |
| F1.1 | UCSD Specimens | 1.00 | 3.52 |
| F1.2 | UCSD Specimens | 1.08 | 3.70 |
| H1.3 | UCSD Specimens | 1.15 | 3.51 |
Fig. C-15.3. Yielding region width/depth ratios that have been tested.
The force determined in Step 2 is the maximum force that is transmitted to each of the external continuity plates at the bottom flange level.
It is the intent of the design criteria to provide a fully restrained (FR) connection. In Step 2, if is less than , analysis is required to justify that the connection is FR. The stiffness of the connection, , may be computed using the following equations, which are derived based on the stiffness of the individual connection plates. Alternatively, other methods or FE models may be used to quantify connection stiffness.
(C15.6-1)
where
| Kbot = 2 ---------------------------------------( 1 1 1 1 1 --- + --- + --- + --- + ---K₁ K₂ K2 K3 K4 ) | (C15.6-2) |
| Ktop = (2P+M-1)s[T2]G ---------------------- [P10]-[P2] | (C15.6-3) |
and where
| G = shear modulus of elasticity of the plate, ksi (MPa) | |
|---|---|
| K1 = ((2[F2]+[F3])[T2]G) / [F4] | (C15.6-4) |
| K2 = (2[F2][T2]G) / [F6] | (C15.6-5) |
| K3 = (2(0.37)E [T2][F2]3) / [F6]3 | (C15.6-6) |
| K4 = ((2[F2]+[F3])[T2]G) / [F8] | (C15.6-7) |
The cover plate design in Step 3 is similar to the design of doubler plates in conventional special moment frame connections. The cover plates are designed to remain elastic under the maximum forces, and they are designed with the same local buckling criteria as traditional doubler plates.
The maximum bolt size requirement in Step 4 is the same as the requirement for the Bolted Flange Plate and Double-Tee connections, even though a plastic hinge is not expected to form in the beam of the DuraFuse Frames connection.
The required number of bolts in Step 5 is governed by bolt bearing strength. Similar to other prequalified bolted connections, the bolts in the DuraFuse Frames connection are pretensioned, but the connection is not slip critical.
The bolts on each line are divided into -bolts and -bolts in Step 5 because there may be different spacing between the bolt on the alignment line and the next bolt in the column direction (see Figure 15.2). It is also convenient to have them differentiated into two groups for some demand calculations (see Step 9 for example). The total number of bolts on each line is the sum of the -bolts and the -bolts.
The maximum beam rotation considered in design is set by the engineer. In Step 6, a minimum value of 0.06 rad ensures good behavior beyond the 0.04 drift limit. The design calculation for the gap between the beam and the column is based on the expected movement of the beam bottom flange toward the column, assuming a center of rotation at the beam top flange. Assuming the center of rotation at the top flange is conservative because in testing, bolt slip of the top bolts has caused the center or rotation to be somewhere between the top flange and the mid-depth of the beam. When the center of rotation is between the top flange and the mid-depth of the beam, rather than at the top flange level, there is less movement of the beam bottom flange for a given rotation angle.
In Step 7, the welds between the cover plates and the column flanges are designed based on the demands shown in Figure C-15.4. Only part of the weld is considered effective for resisting normal forces [Figure C-15.4(c)] because the normal forces are being delivered at the external continuity plate levels.
In Step 8, the welds between the external continuity plates and cover plates are designed based on the demands shown in Figure C-15.5. Only part of the weld is considered effective for resisting normal forces because the load paths near the column flanges are much stiffer for normal forces than the paths through the center of the cover plate.
If normal demands are resulting in large welds, bridge plates (Figure 15.3) can be added to the connection to assist in transmitting the normal force.
The limit states that are checked in Step 9 are illustrated in Figures C-15.6 and C-15.7. The Mode 2 and Mode 3 limit states shown in Figure C-15.6 are outside the definition of “rupture in the net section” because they overlap the welded portion of the external continuity plate. However, Mode 2 and Mode 3 are conservatively checked in addition to the block shear limit state (Figure C-15.7) because they sometimes give lower capacity.
In Step 13, the single-plate shear connection has a required normal strength even though the bolts are slotted in the normal direction. The required normal strength corresponds to the maximum probable slip force that can develop in the bolts.
Step 15 is checking the limit state illustrated in Figure C-15.8 and the similar mode for the fuse plate. Because the top plates may be from a different heat than the fuse plate, the factor is not used for top plate checks, and greater shear area is required for the top plates than the fuse plate.
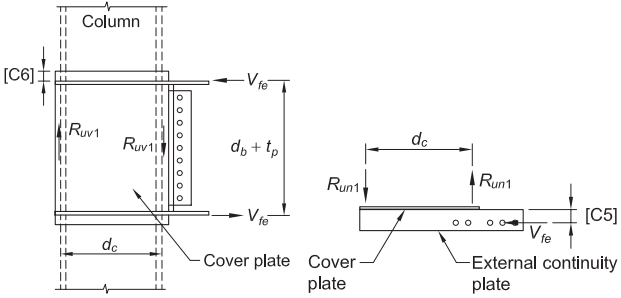
Figure description:
The image consists of technical diagrams illustrating the force distribution and geometric parameters of a structural steel connection, specifically labeled "(a In-plane."
Key Entities and Components
- Column: The main vertical structural member.
- Cover plate: Plate attached to the side of the column.
- External continuity plate: Horizontal plates extending from the column.
Mechanical Actions (Forces/Reactions
- : Horizontal shear forces applied to the external continuity plates.
- : Vertical reaction forces acting along the column interface.
- : Normal/out-of-plane reaction forces shown in the secondary view.
Geometric Parameters
- : Horizontal distance between the vertical reaction forces/supports.
- : Vertical distance between the applied horizontal forces .
- : Specific dimensional offsets or thicknesses for the plates.
(a) In-plane
(b) Out-of-plane
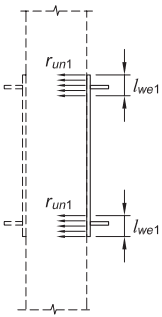
Figure description:
Engineering schematic illustrating out-of-plane distributed forces on a vertical structural member.
Key Entities:
- Vertical Structural Member: Represented by dashed vertical lines.
- Attached Plate: Solid vertical line on the right face.
- : Horizontal arrows representing distributed out-of-plane forces acting to the left.
- : Dimension lines indicating the effective length over which the distributed loads are applied.
Key Information: The diagram depicts a loading condition where out-of-plane distributed forces ( are applied to a vertical member at two distinct locations, each spanning a defined length (.
(c) Out-of-plane distributed
Fig. C-15.4. Weld demands for cover plate welds.
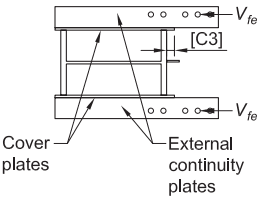
Figure description:
Key Information:
- Topic: Weld demands for cover plate welds in a structural joint (Fig. C-15.4.
- Key Entities:
- Cover plates: Attached to the top and bottom of the primary beam structure.
- External continuity plates: Extended horizontal plates featuring bolt holes, positioned over the cover plates.
- : External force vectors applied to the continuity plates.
- [C3: Specified dimension or clearance between internal vertical stiffeners and the beam edge.
- Internal Structure: Horizontal beam section with vertical stiffening plates connecting the flanges.
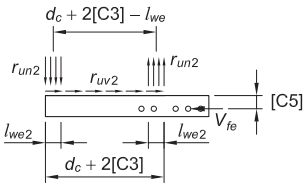
Figure description:
Key Information:
- Diagram Type: Structural engineering diagram illustrating "(a Applied loads."
- Loads:
- : Distributed vertical loads, shown as downward arrows on the left and upward arrows on the right.
- : Distributed horizontal shear load along the top surface.
- : Concentrated horizontal point load applied to the right side.
- Dimensions:
- : Total horizontal distance between outer load boundaries.
- : Horizontal distance between inner load boundaries.
- : Width of the distributed vertical load zones.
- : Vertical thickness or offset dimension of the element.
- Structural Features: A horizontal rectangular member containing four circular internal elements (likely fasteners or holes.
(a) Applied loads
(b) Distributed shear and normal demands
Fig. C-15.5. Weld demands for external continuity plate welds.
Step 16 is checking the limit states illustrated in Figure C-15.9.
Figure C-15.10 shows the lower-bound model that is used in Step 17 to evaluate the capacity of the top plate to resist the combined shear and bending caused by and the eccentricity [P10]-[P2]. The lower-bound model assumes the shear forces are resisted by the “ ” region, and that the bending moment is resisted by the “ ” regions. This capacity check is translated into a minimum required value for [P2] that appears in Step 17.
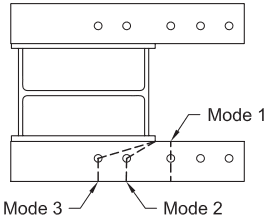
Figure description:
Subject: Tension rupture limit states for an external continuity plate.
Key Components:
- I-beam section: Centrally located profile between two horizontal plates.
- Continuity plates: Top and bottom plates connected to the beam flanges.
- Bolt holes: Multiple holes arranged linearly along the continuity plates.
Failure Modes identified:
- Mode 1: Vertical rupture path across the plate width at the location of the first bolt hole.
- Mode 2: Diagonal rupture path originating from the edge of the beam flange to the second bolt hole.
- Mode 3: Diagonal rupture path originating from the edge of the beam flange to the third bolt hole.
Fig. C-15.6. Tension rupture limit state for external continuity plate.
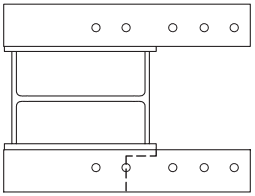
Figure description:
This technical diagram illustrates structural steel limit states for an external continuity plate:
- Components: A central wide-flange beam (I-beam connected to upper and lower external continuity plates.
- Fasteners: Each continuity plate contains five bolt holes.
- Limit States:
- Tension Rupture: Represented by the overall configuration of the plates under load.
- Block Shear: Indicated by the dashed L-shaped failure path on the bottom plate, tracing through the bolt line and extending to the plate's edge.
Fig. C-15.7. Block shear limit state for external continuity plate.
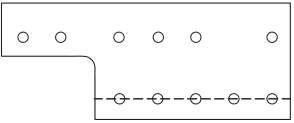
Figure description:
- Entity: Structural steel plate with a notched profile.
- Bolt Holes:
- Top row: 6 circular holes.
- Bottom row: 5 circular holes.
- Failure Path: A dashed horizontal line passes through the center of the bottom row of five holes.
- Key Detail: The dashed line represents a potential shear rupture failure path along the net section of the plate.
- Context: Illustrates a shear rupture limit state for structural design.
Fig. C-15.8. Shear rupture of net section on top plate.
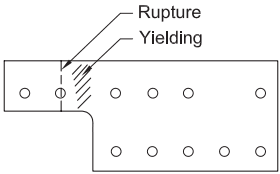
Figure description:
- Entities: Stepped top plate featuring a series of circular bolt holes.
- Rupture: Indicated by a vertical dashed line passing through a hole at the plate's narrowest net section.
- Yielding: Represented by a diagonally hatched area immediately adjacent to the rupture line.
- Function: Illustrates mechanical failure modes (tension rupture and yielding within a structural connection.
Fig. C-15.9. Tension rupture of net section on top plate.
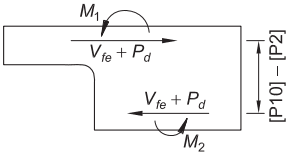
Figure description:
- Subject: Schematic of forces and moments acting on a structural section (likely a top plate in tension rupture analysis.
- Forces (: Two equal and opposite horizontal force vectors acting on the top and bottom of the notched section.
- Moments (:
- : Clockwise moment acting on the top surface.
- : Clockwise moment acting on the bottom surface.
- Dimensions: The vertical distance between the two horizontal forces is labeled .
- Contextual Equation: .
For plate check, conservatively assume :
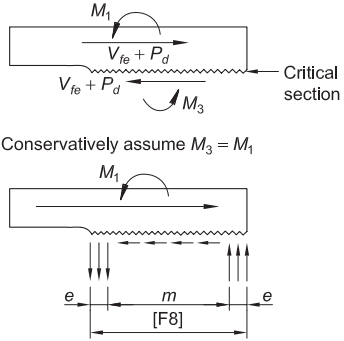
Figure description:
Figure C-15.10: Lower Bound Model for Top Plate Yield Strength
- Primary Entities: Structural top plate subject to combined shear ( and flexure (.
- Key Assumptions: Conservatively assumes .
- Critical Section: Represented by a jagged horizontal interface where shear and moments are transferred.
- Stress Distribution Model:
- Vertical force couples (downward on the left, upward on the right across widths labeled , separated by distance .
- Horizontal shear stress indicated by leftward-pointing arrows.
- Total effective width for force distribution is labeled as .
- Mathematical Context: .
Fig. C-15.10. Lower bound model to check top plate yield strength for combined shear and flexure.
In Step 18, checks are made for limit states that are related to the dimension [F6]. Figure C-15.11 illustrates the net section that is being checked.
In Steps 18 and 19, the dimensions of the yielding regions (YR) on the fuse plates are determined and compared with the dimensions that have been investigated experimentally.
In Step 19, the equation for determining [F2] appears complicated because it incorporates an expression for strain hardening that depends on the geometry of the yielding region. The cyclic shear hardening factor, , for the yielding regions of the fuse plates has been calibrated from the various qualification experiments. This special hardening factor quantifies an increase in ultimate shear stress beyond what is calculated by .
The factor is comparable, in some respects, to the factor used for other moment connections, but differs in that it is used in conjunction with the expected ultimate stress, , rather than in conjunction with the expected yield stress, . The cyclic shear hardening factor depends on the width-to-depth ratio of the yielding region but is also influenced by the width-to-thickness ratio. The cyclic shear hardening factor, , that is incorporated into the design equations is:
(C-15.6-8)
where , and are calibrated factors: , and .
Table C-15.1 compares the cyclic shear strain hardening observed in experimental testing, , with values of from the calibrated equation for the specimens where the testing was continued all the way through fuse plate tearing. The values for in Table C-15.1 indicate that the calibrated equation for is reasonable, although it is quite conservative for Specimen D1.1.
The limit states being checked in Step 20 are illustrated in Figure C-15.12.
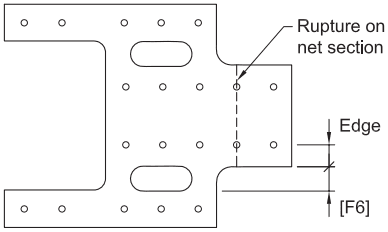
Figure description:
- Subject: Engineering diagram of a structural plate illustrating limit states.
- Key Limit State: "Rupture on net section," indicated by a vertical dashed line passing through a column of circular holes.
- Primary Dimension: [F6, a vertical dimension at the bottom-right of the plate's central body.
- Secondary Annotation: "Edge" distance, shown from a hole center to the plate's boundary.
- Physical Features: Metal plate containing multiple circular bolt holes and two horizontal oval slots.
Fig. C-15.11. Limit states related to dimension [F6].
| Specimen | w/d | w/t | Ch,exp | Ch,des | Ch,des/Ch,exp |
|---|---|---|---|---|---|
| B3.1 | 0.697 | 2.88 | 1.16 | 1.15 | 1.00 |
| B3.2 | 0.697 | 2.88 | 1.17 | 1.15 | 0.990 |
| B3.3 | 0.821 | 2.88 | 1.08 | 1.13 | 1.05 |
| B3.4 | 0.767 | 2.88 | 1.13 | 1.14 | 1.01 |
| C2.1 | 0.600 | 2.50 | 1.13 | 1.20 | 1.06 |
| D1.1 | 1.05 | 3.15 | 0.930 | 1.07 | 1.15 |
| E1.2 | 0.890 | 4.00 | 1.03 | 1.02 | 0.990 |
| F1.2 | 1.08 | 3.20 | 0.990 | 1.06 | 1.07 |
| G1.2 | 0.940 | 3.20 | 1.07 | 1.08 | 1.01 |
| H1.3 | 1.14 | 2.29 | 1.15 | 1.13 | 0.980 |
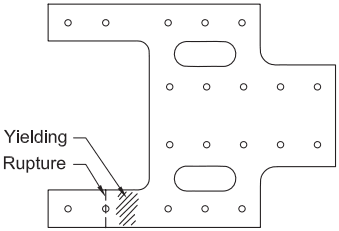
Figure description:
The image is a technical diagram illustrating fuse fracture limit states (Fig. C-15.12 for a mechanical or structural component.
Key Entities and Information:
- Component: A plate with a series of circular bolt holes and two oblong slots.
- Limit States:
- Yielding: Indicated by a cross-hatched region on a narrow section of the plate.
- Rupture: Indicated by a dashed vertical line passing through a bolt hole, adjacent to the yielding zone.
- Context: These states are checked during Step 20 of a specific design procedure.
Fig. C-15.12. Fuse fracture limit states that are checked in Step 20 of the design procedure.