9.3.1 Design Principles
9.3.1.1 Overview
A “bearing” joint is one which has slipped until the fasteners “bear” on the holes as illustrated by Figure 9-10. A joint is also considered to be a bearing joint when a tight tolerance shaft (or plug gauge) is used.
Bearing type joints are mostly used where the necessary clamping force to prevent slip exceeds the clamped material’s under-head crushing strength (see Section 7.11). Such joints are therefore preloaded to a level below the flange’s crushing strength, but sufficiently high to lock the fastener under transverse vibration. The joint is then allowed to slip into bearing, where the shear load is transmitted via the fasteners into the flanges via bearing stress within holes.
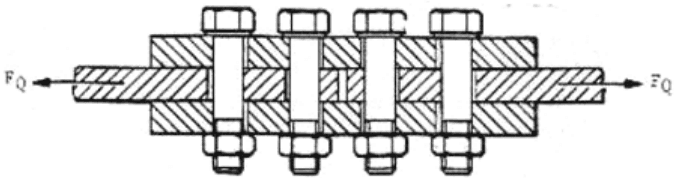
Figure description:
- Entities: Four hex-head bolts, four nuts, and three overlapping horizontal plates.
- Force: Lateral shear force vectors labeled "" acting in opposite directions on the central plate.
- Configuration: A cross-sectional view of a bolted joint assembly where the central plate is positioned between two outer plates.
- Details: Cross-hatching indicates material sections; the central plate appears segmented or jointed between the second and third bolts.
Figure 9-10 - Shear Joint in Bearing
Figure 9-11 shows a lap joint with a large number of fasteners. In such joints some of the fasteners, due to their position at the end of the fastener row, take a higher load than others. When the external shear load is applied, some load redistribution invariably takes place due to local line contact yielding. However, after this redistribution the outer fasteners can still experience shear loads some 15 % above average.
Note that this type of joints are not recommended. A preferred design is to have the joint transferring the shear loads by friction.

Figure description:
- Text: E CSS
- Layout: Parallelogram with a blue border divided into two sections.
- Left section: White background containing a blue, italicized letter "E".
- Right section: Blue background containing the letters "CSS" in white.
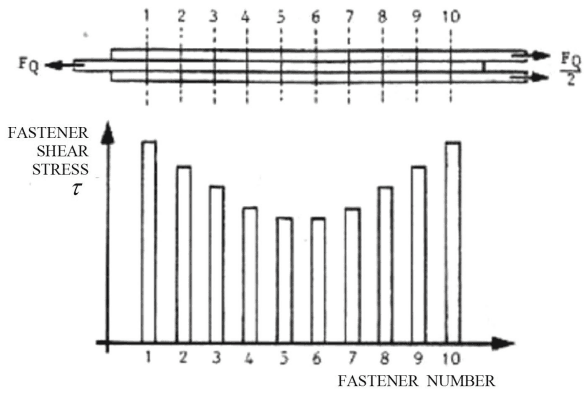
Figure description:
Fastener Shear Stress Distribution in a Lap Joint
Fastener Shear Stress τ vs. Fastener Number
| Fastener Number | Fastener Shear Stress (τ, Relative) |
|---|---|
| 1 | 1.00 |
| 2 | 0.85 |
| 3 | 0.72 |
| 4 | 0.61 |
| 5 | 0.56 |
| 6 | 0.56 |
| 7 | 0.61 |
| 8 | 0.72 |
| 9 | 0.85 |
| 10 | 1.00 |
Notes: The figure illustrates the distribution of fastener shear stress in a double-lap joint with 10 fasteners. The diagram shows a central plate pulled with force F_Q and two outer plates each pulled with F_Q/2. The shear stress distribution is symmetric, peaking at the outermost fasteners (1 and 10 and reaching a minimum at the central fasteners (5 and 6. Stress values in the table are normalized based on the visual height of the bars.))
Figure 9-11 - Long Bearing Shear Stress Distribution
9.3.1.2 Thread Within the Hole
An important design feature of any bearing joint is the number of disengaged threads in the load path within the joint. This is illustrated by Figure 9-10, in which the threaded regions of the fasteners extend partially into the hole, proportionately increasing the hole bearing stress. In the extreme case where the interface plane passes through a threaded part of the fastener, its shear area is reduced from the shank cross-sectional area, Asha , to the thread’s stress area, AS . For these reasons, it is recommended that the thread be carefully dimensioned to minimise the length of disengaged thread in the joint, while also ensuring that there is sufficient thread to account for manufacturing tolerances.
9.3.1.3 Pivoting Bearing Joint
Another type of bearing joint that is commonly found in mechanisms where relative rotation of the flanges about a single fastener pivot (scissors action) is a design requirement. In this case the nut needs a locking mechanism and the fastener preload is negligibly low. The fastener is therefore predominantly subject to transverse shear and bearing loads between fastener and hole. Also, depending on the degree of eccentricity of the applied load, the bending stresses within the fastener can be significant.
9.3.1.4 Strength Analysis of Bearing Joints
The strength of a bearing designed shear joint depends on its resistance in three failure modes; fastener shear, hole bearing and flange shear-out failure. The strength calculation methods for each of these failure modes are given in the following Sections.
9.3.2 Fastener Shear Failure
9.3.2.1 Overview
For the calculation of the shear resistance of the fastener’s cross-section at the joint’s shearing plane has to be used. If the thread is lying in the shear plane, the fastener’s stress cross-sectional area to be used is AS . Otherwise, the fastener’s shank is in the shear plane and it is important to use its cross-sectional area Asha .
9.3.2.2 Pure Shear
The MoS for shear failure of the fastener are as follows:
where and are the yield and ultimate shear stresses for the fastener, and is the cross-sectional area at the shear plane (either or ).
9.3.2.3 Combined Shear and Axial Loads
In a bearing design the preload is chosen to ensure that the assembled joint can slip into bearing at the first external shear load application. It is therefore necessary to calculate the slip load and preload the fasteners to a level below that the one to prevent slip.
The joint’s strength depends not only on the shear and tension interaction in the fastener but also on the dimensions and material properties of the clamped parts. The relative magnitude of the axial and shear components of the combined loading can make it necessary to reduce the axial preload in order to allow more of the fastener’s strength to be used in shear. It is therefore necessary, when designing a bearing joint experiencing both tension and shear loads, to work backwards to a remaining clamping force rather than size the fastener by the preload requirements.
The fastener’s shear capacity depends not only on the bolt size and its material shear strength, but also on the levels of axial and torsional stress in the triaxial stress system in its shearing planes.
The equations [9.3.3], [9.3.4], [9.3.5] and [9.3.6] assume that all torsional stresses (due to torque tightening) are removed by embedding, and bending stresses are small. Under these assumptions only the interaction between axial and shear stress are considered within the fastener.
In cases where it cannot be assumed that bearing joints have negligible fastener bending, it is important to apply more comprehensive fastener failure theories.
Thus, the verification of the combined loaded bearing joint uses stress interaction relations. If the thread is in the shear plane (not a recommended design practice), it is important to satisfy the following combined stress interaction relations:
If the shank is in the shear plane, the following stress interaction relations can be used:
The above equations [9.3.3] to [9.3.6] use the following ratios for the fastener’s strength utilisation ratios:
If gapping is tolerable, the stress interaction relations is also to be checked with Equations [9.3.7] and [9.3.8] replaced by the following (overall axial load) equations respectively:
The margins of safety for combined axial and shear forces acting on the fastener are,
The calculation of the margin of safety on combined loads for equation [9.3.3&4] is graphically depicted in Figure 9-12. Point A represents a loading case that results in a combined margin of safety below the critical level. Point B represents the margin of safety for a higher loading case at the critical level but with the same ratio between the combined loads. This graphical interpretation cannot be used for the cubic terms in equations [9.3.5&6].
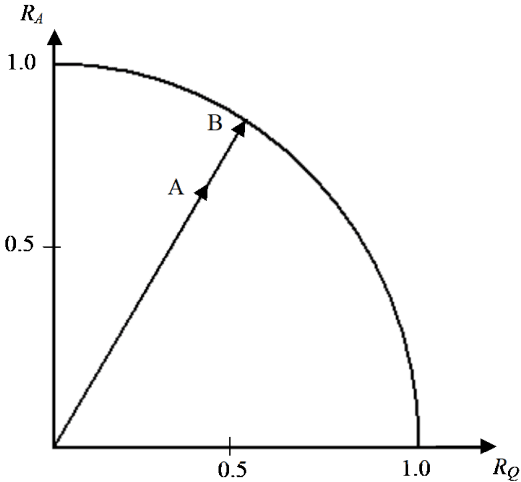
Figure description:
Relationship between R_A and R_Q
Annotations
- A (text_label - position: R_Q ≈ 0.30, R_A ≈ 0.60)
- B (text_label - position: R_Q ≈ 0.45, R_A ≈ 0.89)
- Vector (arrow - position: Starts at (0,0, passes through point A, and ends at point B on the curve))
- Boundary Curve (line - position: Quarter-circle arc defined by R_Q^2 + R_A^2 = 1)
| Point Type | R_Q | R_A | Label |
|---|---|---|---|
| Boundary Curve | 0.00 | 1.00 | |
| Boundary Curve | 0.20 | 0.98 | |
| Boundary Curve | 0.40 | 0.92 | |
| Boundary Curve | 0.60 | 0.80 | |
| Boundary Curve | 0.80 | 0.60 | |
| Boundary Curve | 1.00 | 0.00 | |
| Vector Path | 0.00 | 0.00 | Origin |
| Vector Path | 0.30 | 0.60 | A |
| Vector Path | 0.45 | 0.89 | B |
Notes: The chart illustrates a production possibility frontier or a similar efficiency boundary between two variables, R_A and R_Q. A directional vector originates from the origin, indicating a path or progression through point A to point B, which lies exactly on the boundary curve.
Figure 9-12 - Graphical Determination of the Margin of Safety on Combined Loads
9.3.2.4 Shear Strength of Fastener Group with Hole Tolerance
When a joint has more than one fastener, hole tolerances cannot be perfect and thus a clearance between hole and fastener. This clearance requires extra deformations to bring the full set of fasteners into bearing, and creates a reduction in the strength of the joint.
The theory in Reference 9.1 can be used to calculate the total bearing strength of a fastener group with hole clearances at their maximum tolerance bounds. The theory makes the following limiting assumptions:
Steel fasteners in aluminium flanges Fastener shanks are in bearing (i.e. no thread in holes)
The theory use a conservative approach whereby the first fastener to fail is in the hole at the maximum tolerance bound, whereas as all other holes are at the centre of their tolerance bounds. This situation is shown in Figure 9-13.
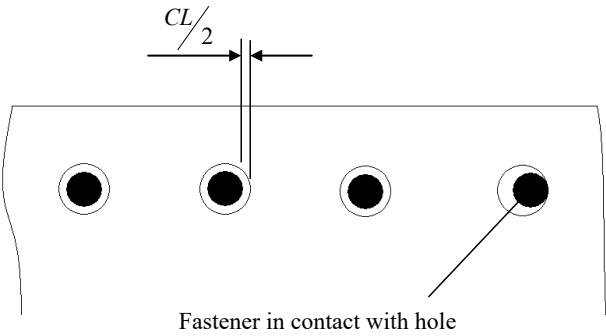
Figure description:
- Row of four fasteners (black circles within holes (white circles.
- Three fasteners are centered within their holes.
- One fastener (far right is in contact with the edge of its hole.
- Label: "Fastener in contact with hole" pointing to the rightmost fastener.
- Dimension: "CL / 2" indicating the clearance gap between a centered fastener and its hole edge.
Figure 9-13 - Fastener Group with hole clearance
The combined strength of the fastener group is the ideal strength assuming perfect tolerances (i.e. the total shear strength of all fastener shanks), minus the force capable to bring all fastener shanks into bearing, i.e.
where n is the number of fasteners in the bearing joint and FCL is the shear force capable to move the fastener shank by a distance equal to the hole clearance.
Where F CL * is a parameter given by the empirical relation,
The variable, , is the hole clearance, which is defined as .
Equation [9.3.17] is graphically presented in Figure 9-14.
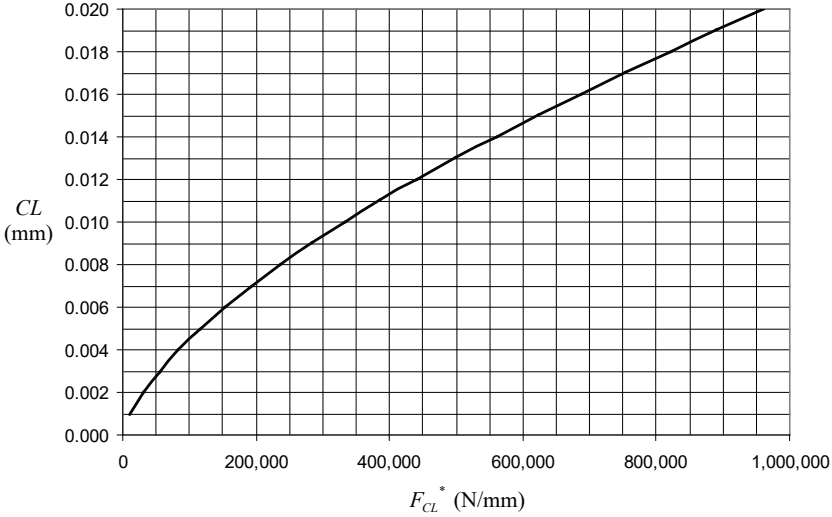
Figure description:
| FCL* (N/mm) | CL (mm) |
|---|---|
| 0 | 0.0000 |
| 40000 | 0.0022 |
| 80000 | 0.0036 |
| 120000 | 0.0048 |
| 160000 | 0.0058 |
| 200000 | 0.0068 |
| 240000 | 0.0077 |
| 280000 | 0.0085 |
| 320000 | 0.0093 |
| 360000 | 0.0100 |
| 400000 | 0.0107 |
| 440000 | 0.0114 |
| 480000 | 0.0121 |
| 520000 | 0.0127 |
| 560000 | 0.0134 |
| 600000 | 0.0140 |
| 640000 | 0.0146 |
| 680000 | 0.0152 |
| 720000 | 0.0158 |
| 760000 | 0.0164 |
| 800000 | 0.0170 |
| 840000 | 0.0176 |
| 880000 | 0.0182 |
| 920000 | 0.0188 |
| 960000 | 0.0194 |
| 1000000 | 0.0200 |
Notes: The chart illustrates the relationship between FCL* (N/mm and displacement CL (mm. The relationship is characterized by a smooth curve that increases at a decreasing rate. Key points where the curve intersects grid lines include (360,000, 0.010, (600,000, 0.014, (800,000, 0.017, and (1,000,000, 0.020.))))))
Figure 9-14 - Shear load parameter versus hole clearance
Figure description:
- Text: ECSS
- Visual elements:
- Letter "E": Italicized, white font on a blue rectangular background.
- Letters "CSS": Blue, serif font on a white background.
- Border: Entire logo is enclosed in a blue-outlined parallelogram.
9.3.3 Net Tension Section Failure of Flanges
9.3.3.1 Overview
The method for evaluating net tension section failure is taken from Reference 9.2. By this theory, the net tension section is defined as the smallest area that is obtained by deducting the summed area of all holes lying in any potential failure path (straight or zig-zag) across a flange from the gross cross-sectional sectional area. It is important to consider t his failure mode considered for both friction grip joints and bearing joints.
In order to obtain a sufficiently large net tension section area to transmit the tension load through the flange, it is necessary to meet the following condition:
where is the yield strength of the respective flange, and is a reduction factor for the flange material's ultimate strength (see Section 9.3.3.2 below), and is the smallest net tension section area calculated by,
where is the flange area ignoring the presence of the holes, and is the summation of the hole areas along the 'th potential path across the flange.
The summation of the holes’ areas, Aholes , considers the full area of the first hole but then only fractional parts of each succeeding hole, and is calculated by,
where pi and si are the lateral and longitudinal distances between the centres of the i'th and (i -1)’th holes (see Figure 9-15), and t is the thickness of the flange, and it is important that the expression inside the angled brackets is replaced with zero if it evaluates to a negative value.
Figure 9-15 shows the nomenclature used to define the net tension section.
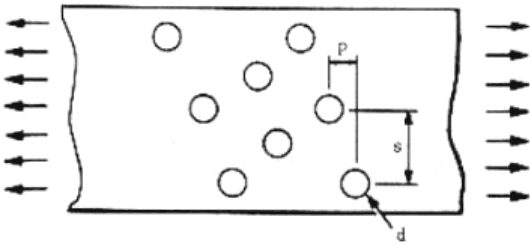
Figure description:
- Rectangular flange subject to tension (indicated by outward-pointing arrows on left and right.
- Staggered pattern of ten circular holes.
- p: Lateral distance between the centers of two adjacent holes.
- s: Longitudinal distance between the centers of two adjacent holes.
- d: Diameter of a hole.
Figure 9-15 - Nomenclature for Net Tension Section Calculation
The margin of safety on net tension section failure is therefore given by,
9.3.3.2 Net Section Data for Some Aluminium Alloys
Aluminium alloys develop a net ultimate stress that varies according to the proportion of area lost through holes. The curves in Figure 9-16 give reduction factors to be applied in Equation [9.3.20]. The curves correspond to the following general groups of alloys:
- • Al-Cu solution treated and naturally aged sheet and plate (e.g. L163 2014 A CLAD 105OA-T3)
- • Al-CuAl-Zn solution treated and artificially aged sheet or plate (e.g. L165 2014 A CLAD 105OA- T6, L88 7075 CLAD 7072-T6)
- • Al-Cu solution treated and naturally aged extruded bar (e.g. L102 2014 A T4),
- • Al-Cu solution treated and artificially aged extruded bar (e.g. L168 2014 A - T6510, DTD 5124 Al- Zn, 7075-T6)
With the exception of curve 3, the data in Figure 9-16 is applicable to loadings that are either longitudinal or transverse to the grain (or final direction of rolling). There is also some limited evidence that curve 1 can be applicable to naturally aged extruded bar loaded in the transverse direction.
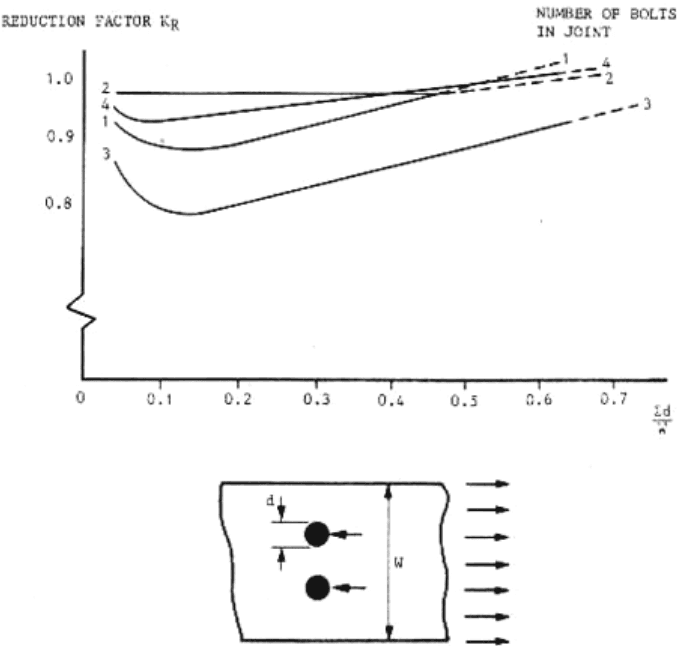
Figure description:
Effect of Number of Bolts and Σd/w on Reduction Factor KR NUMBER OF BOLTS IN JOINT
REDUCTION FACTOR KR
Legend
- 1 Bolt — color: black; symbol: Line 1
- 2 Bolts — color: black; symbol: Line 2
- 3 Bolts — color: black; symbol: Line 3
- 4 Bolts — color: black; symbol: Line 4
Annotations
- Axis break on Y-axis (vertical_line - position: y between 0 and 0.8)
- Solid lines indicate measured or primary data region (text_label - position: left side of chart)
- Dashed lines indicate extrapolated data region (text_label - position: right side of chart)
| Σd/w | 1 Bolt | 2 Bolts | 3 Bolts | 4 Bolts |
|---|---|---|---|---|
| 0.05 | 0.920 | 0.975 | 0.860 | 0.950 |
| 0.10 | 0.890 | 0.975 | 0.800 | 0.930 |
| 0.15 | 0.880 | 0.975 | 0.790 | 0.935 |
| 0.20 | 0.885 | 0.975 | 0.800 | 0.945 |
| 0.30 | 0.920 | 0.975 | 0.835 | 0.965 |
| 0.40 | 0.965 | 0.975 | 0.870 | 0.990 |
| 0.50 | 1.000 | 0.985 | 0.905 | 1.005 |
| 0.60 | 1.030 | 1.000 | 0.935 | 1.020 |
| 0.70 | null | 1.010 | 0.965 | 1.025 |
Notes: The chart shows the relationship between the reduction factor KR and the ratio of total bolt diameter to plate width (Σd/w for different numbers of bolts in a joint. A schematic diagram at the bottom illustrates the variables d (bolt diameter and w (plate width under tensile load.)))
Figure 9-16 - Ultimate Strength Reduction Factors for Net Tension Section Failure
The curves in Figure 9-16 are based on data from tests on specimens with unfilled holes, however spot checks have shown that they can be applied to loaded holes. The data was derived from specimens where the edge distance of the holes was 4d. From the general shape of the curves it can be assumed that they are applicable at lower edge distances, say to 2d.
9.3.4 Hole Bearing Failure
After slipping one or more fasteners bear against the side of their holes. Initially, an elastic bearing stress is developed in the plate material adjacent to the hole, as indicated in Figure 9-17, peaking at the line contact. An increase in the shear force FQ causes further plastic elongation of the hole, as shown in Figure 9-18. In most cases a linear stress distribution, shown in Figure 9-19, can give an adequate approximation, whereby the bearing stress is,
where t is the thickness of the flange, and d is the diameter of the fastener.
If the fastener’s thread extends within the hole, it is important to assume that the threaded region of the fastener is not capable of transmitting any bearing stress. In such cases, it is important to decrease the value of t in Equation [9.3.22] accordingly.
In most cases, the value of d in Equation [9.3.22] is equal to the nominal hole diameter, Dh . However, if the fastener’s diameter is significantly smaller than that of the hole, it is important to use the smaller (fastener) diameter. This situation typically occurs in multi-fastener joints where deliberately loose tolerances are needed to ensure assembly of pre-drilled parts.
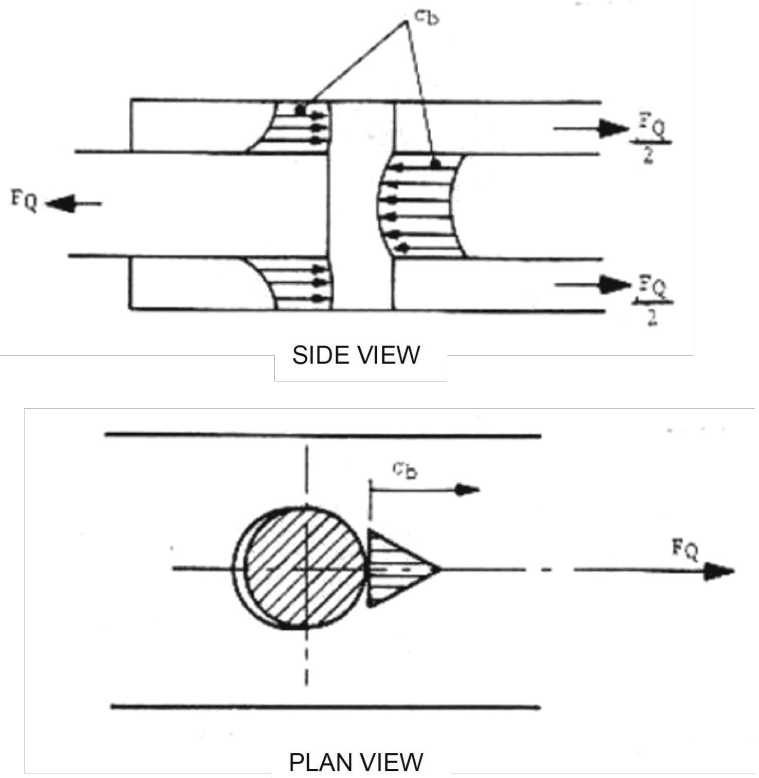
Figure description:
- SIDE VIEW:
- Entities: Central plate being pulled by force to the left; two outer plates being pulled by forces to the right; a central fastener.
- Stress Distribution: Non-linear elastic bearing stress profiles labeled are shown at the contact interfaces between the fastener and the plates.
- PLAN VIEW:
- Entities: A circular fastener (hatched within a hole; a horizontal centerline and a vertical centerline.
- Forces: A force pulling to the right.
- Stress Distribution: A triangular-shaped bearing stress distribution labeled peaks at the line contact between the fastener and the edge of the hole.
Figure 9-17 - Initial Bearing Contact Elastic Stresses and Deformations
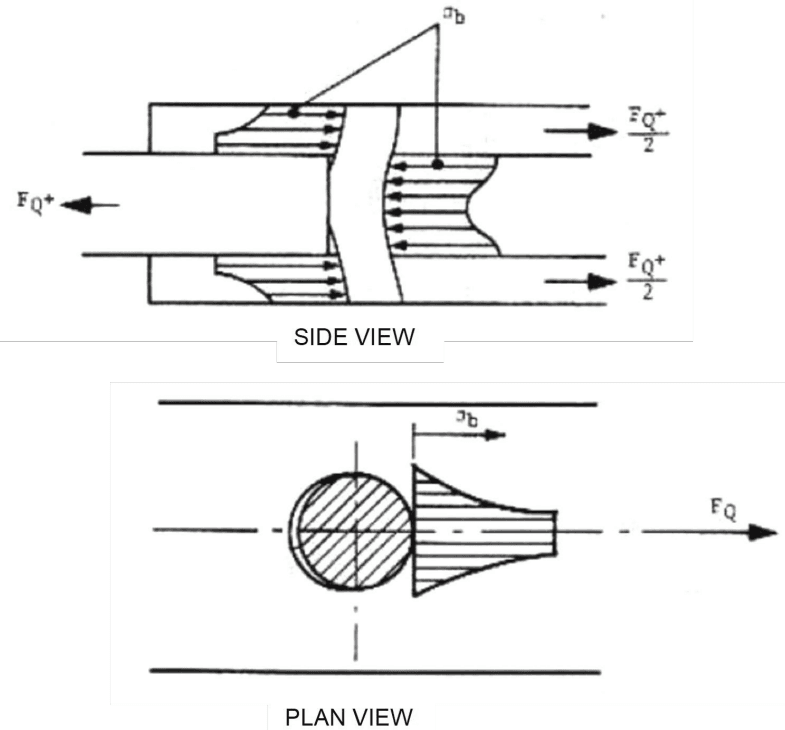
Figure description:
The provided image displays two diagrams labeled "SIDE VIEW" and "PLAN VIEW," illustrating mechanical stresses and forces on a joint.
Key Entities and Details:
-
SIDE VIEW:
- Components: Three horizontal plates joined by a vertical pin or bolt. The middle plate is being pulled to the left, while the outer two plates are pulled to the right.
- Forces: is applied to the left on the center plate. Two forces of are applied to the right on the outer plates.
- Stress Distribution (: Non-uniform bearing stress profiles are shown at the contact interfaces between the pin and the plates.
- Deformation: The vertical pin shows visible curvature/bending.
-
PLAN VIEW:
- Components: A cross-section of a circular pin within a plate.
- Force: A force is applied to the right.
- Stress Distribution (: A curved stress distribution profile is shown acting on the edge of the circular pin, indicating bearing pressure.
- Geometry: Includes centerlines for the circular pin.
Figure 9-18 - Elastic / Plastic Stresses and Deformations After Increased Loading
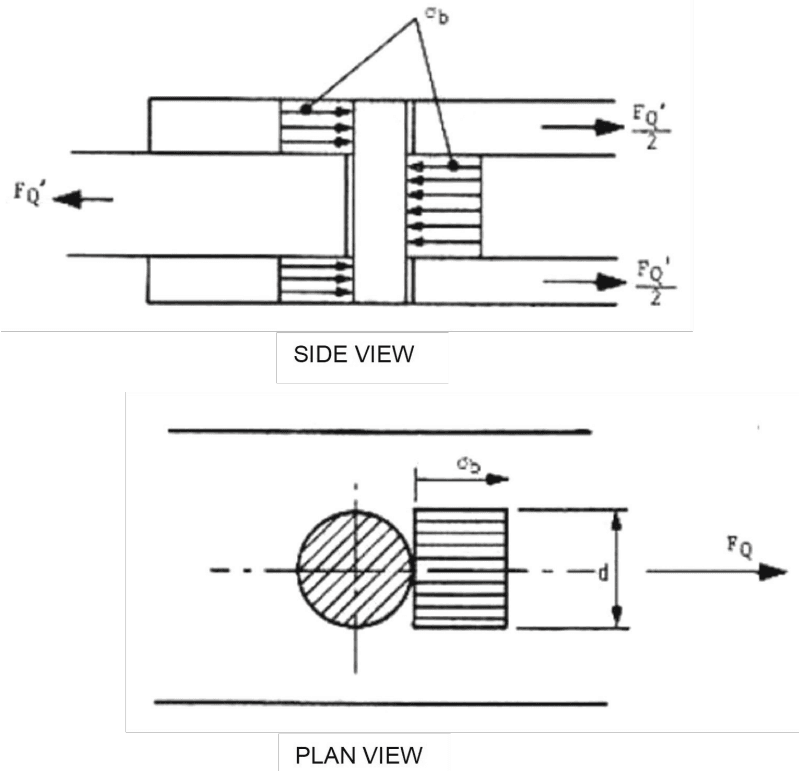
Figure description:
The provided image contains a technical diagram showing "SIDE VIEW" and "PLAN VIEW" of a pinned or bolted joint under load.
Key Entities and Information:
- Views:
- SIDE VIEW: Displays a cross-section of a three-plate assembly joined by a vertical cylindrical fastener.
- PLAN VIEW: Displays a cross-section through the center plate and fastener.
- Forces:
- : Total horizontal force acting to the left on the center plate.
- : Horizontal reaction forces acting to the right on the two outer plates.
- : Horizontal force vector in the plan view.
- Stresses and Dimensions:
- : Bearing stresses indicated by uniform rectangular pressure distribution blocks acting between the plates and the fastener.
- : Diameter of the fastener or the width of the bearing stress distribution.
- Mechanical Components:
- A central plate and two outer plates.
- A cylindrical fastener (pin or bolt.
Figure 9-19 - Idealised Bearing Stresses
It is important to compare the bearing stress calculated with equation [9.3.22] to the allowable values for yield, σ br , y , and ultimate, σ br , ult , bearing strength of the flange material. These allowable values are listed in Reference 9.3 for spaceflight-proofed materials for edge distance ratios al /Dh of 1,5 and 2,0, and for flange thickness ratios t D h in the range 0,25 to 0,5.
For al /Dh less than 1,5 it can be assumed that the shear-out failure mode can be more critical (see Section 9.3.5 below). Above an edge distance ratio of 2,0 the bearing strength is constant. If the edge distance is in the intermediate range (i.e. 1,5<a l /Dh<2,0), it is important to interpolate the bearing strength linearly from the values at 1,5 and 2,0.
The margins of safety on hole bearing strength are calculated as follows:
Note that the variable, d, in the above equations is the diameter of the fastener and not the diameter of the hole. This distinction is important for joints with oversized holes, in which case the bearing area is determined by the fastener diameter.
9.3.5 Shear-Out or Tear-Out Failure
Shear-out or tear-out failure, as illustrated in Figure 9-20 and Figure 9-21 respectively, can occur when the fasteners are located close to the edge of the plate. These modes of failure do not need to be considered for fasteners that are more than 2d from a flange edge.
Figure 9-20 - Shear-Out Failure
Figure 9-21 - Tear-Out Failure
To calculate the shear stress in the flange, τ, the minimum shear-out length is used. Referring to the notation of Figure 9-22, this length is given by,

Figure description:
- Text: "E CSS"
- Design: Slanted rectangular frame divided into two color-coded sections.
- Left section: White background with a purple italicized letter "E".
- Right section: Purple background with white letters "CSS".
- Entity: ECSS logo.
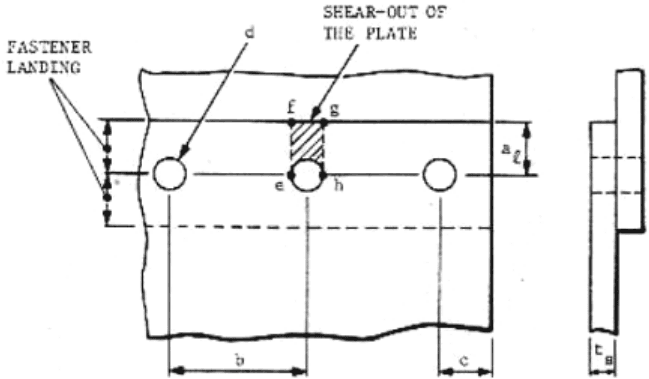
Figure description:
- Diagram: Figure showing nomenclature for plate shear-out calculation.
- Entities and Labels:
- FASTENER LANDING: Identified by arrows pointing to the vertical spacing around the fastener holes.
- d: Fastener diameter.
- e, f, g, h: Points defining the shear-out area.
- SHEAR-OUT OF THE PLATE: Shaded rectangular region between points f, g, e, and h.
- aₗ: Distance from the fastener centerline to the plate edge.
- b: Spacing between fastener centerlines.
- c: Distance from the last fastener centerline to the side edge of the plate.
- tₛ: Plate thickness (shown in side view.
- Visual Elements:
- Plan view of a plate with three fastener holes.
- Side view showing the plate profile.
- Shaded region representing the material section subject to shear-out.
Figure 9-22 - Nomenclature for Plate Shear Out Calculation
The following condition is the relation to be satisfied by the design, for each fastener near (within 2d) an edge:
where t is the thickness of the flange, and FQ is the component of the fastener’s load acting towards the nearest edge of the flange.
This leads to the following margin of safety on shear-out,