Point E of Figure 7-26 represents a joint tightened to a preload FV,1 , which induces stresses in the fastener that are below its yield stress. At the first application of the external load, FA , the fastener feels an extra load ∆ F b , A 1, , which takes its highest stressed region beyond its yield strength (along the path EFG.). This causes permanent deformation of the fastener ∆ and local work hardening of the deformed material. If the applied external load is then removed, the fastener’s preload can reduce from point E to a lower value, point H. If FA is reapplied, the fastener load needs to exceed point G before that work hardened part of the fastener can yield again. However, there can be an adjacent part of the fastener that yields at a lower load (as it has not workhardened) allowing further permanent deformation to take place.
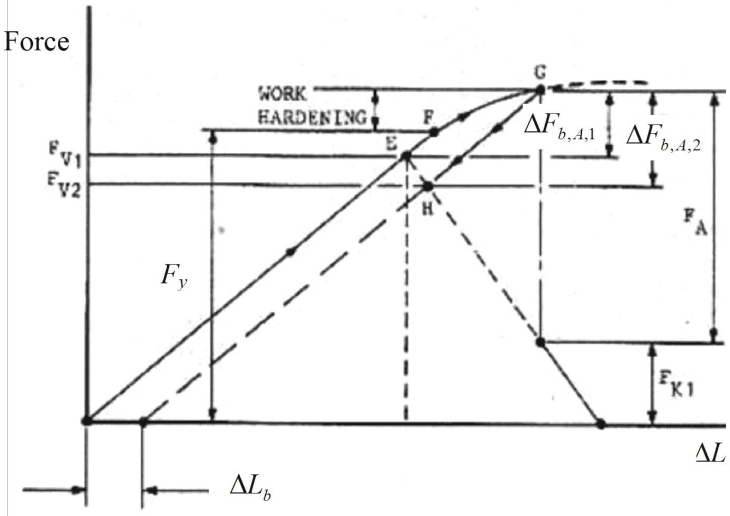
Figure description:
Mechanical Force-Displacement and Work Hardening Analysis
Force vs. Displacement ( Characteristic Diagram
Legend
- Loading Curve — color: black; symbol: Solid curve passing through E, F, and G
- Reference Line — color: black; symbol: Dashed line starting from and passing through H and G
- Unloading Curve — color: black; symbol: Solid straight line descending from G
Annotations
- WORK HARDENING (shaded_area - position: Vertical region between force levels (at point E and (at point G)))
- (vertical_line - position: Vertical span indicating yield force level)
- (horizontal_line - position: Force level at point E)
- (horizontal_line - position: Force level at point H)
- (vertical_line - position: Force difference between level and )
- (vertical_line - position: Force difference between level and )
- (vertical_line - position: Total peak force at point G)
- (vertical_line - position: Force level during the unloading phase)
- (horizontal_line - position: Initial displacement offset for the dashed reference line)
| Point | X-coordinate () | Y-coordinate (Force) | Description |
|---|---|---|---|
| Origin | 0 | 0 | Start of solid loading curve |
| E | Elastic limit point on loading curve | ||
| F | Intermediate point in work-hardening region | ||
| G | Peak force point; intersection of loading, reference, and unloading lines | ||
| Offset Start | 0 | Start of dashed reference line on the displacement axis | |
| H | Point on dashed reference line at force level | ||
| Unloading End | 0 | Final displacement after unloading |
Notes: This engineering diagram depicts the mechanical behavior of a material or component under loading, highlighting the transition from linear elastic behavior at point E to work hardening up to point G. It also shows a dashed reference line shifted by an initial displacement and the subsequent unloading path.
Figure 7-26 – Joint Diagram Showing Repeated Loading into the Plastic Region
The result of continued loading as shown in Figure 7-26 is a non-linear preload reduction with each subsequent load application as shown in Figure 7-27 (see Reference 7.3). This is not a desirable situation, and therefore, in normal circumstances it is important to avoid a loading above the fastener yield.
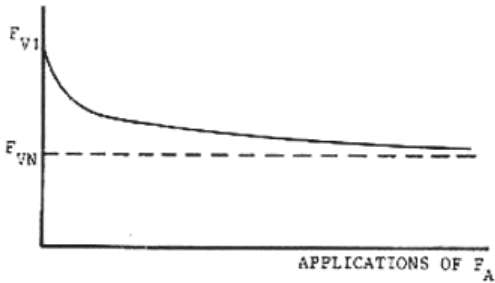
Figure description:
Legend
- Solid curve starting at F_V1 — symbol: Solid line
- Asymptote at F_VN — symbol: Dashed line
Annotations
- F_V1 (text_label - position: y-axis intercept)
- F_VN (horizontal_line - position: y = F_VN)
| APPLICATIONS OF F_A | Curve (Solid) | Baseline (Dashed) | | :--- | :--- | :--- | | 0 | F_V1 | F_VN | | Increasing | Decreasing towards F_VN | F_VN |
Notes: The chart depicts a solid curve that starts at the value F_V1 on the vertical axis and decreases monotonically, asymptotically approaching a constant value F_VN as the number of 'APPLICATIONS OF F_A' increases. The value F_VN is indicated by a horizontal dashed line.
Figure 7-27 – Preload Loss with Repeated Loading into Yield