7.3.1 Overview
The deformations within a joint can be shown in the joint diagram. Figure 7-2 shows the elongation of the fastener, ∆ b V , due to the preload, FV , and Figure 7-3 shows the corresponding deflection of the clamped parts.
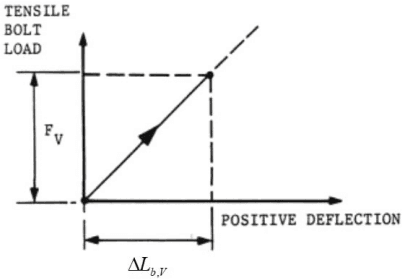
Figure description:
Tensile Bolt Load Characteristics
Tensile Bolt Load vs. Positive Deflection
Annotations
- F_V (dimension_line - position: Vertical dimension along the y-axis from 0 up to F_V)
- ΔL_{b,V} (dimension_line - position: Horizontal dimension along the x-axis from 0 to ΔL_{b,V})
- Loading arrow (arrow - position: Located on the solid line segment pointing from the origin toward (ΔL_{b,V}, F_V))
- Coordinate dashed line (Horizontal (dashed_line - position: Horizontal dashed line at y = F_V from the y-axis to (ΔL_{b,V}, F_V)))
- Coordinate dashed line (Vertical (dashed_line - position: Vertical dashed line at x = ΔL_{b,V} from the x-axis to (ΔL_{b,V}, F_V)))
- Linear extension (dashed_line - position: Dashed line extending the linear relationship beyond the point (ΔL_{b,V}, F_V))
| POSITIVE DEFLECTION | TENSILE BOLT LOAD |\n| :--- | :--- |\n| 0 | 0 |\n| ΔL_{b,V} | F_V |
Notes: The diagram illustrates the relationship between tensile bolt load and positive deflection, showing a linear response starting from the origin. The specific point (ΔL_{b,V}, F_V is highlighted as a reference state.)
Figure 7-2– Fastener Stiffness
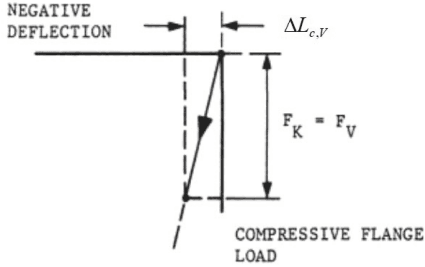
Figure description:
- Labels: NEGATIVE DEFLECTION, COMPRESSIVE FLANGE LOAD
- Variables: , ,
- Mathematical Relation:
- Visual Components:
- A coordinate system with a vertical axis for load and a horizontal axis for deflection.
- A sloped line (vector indicating a relationship between the compressive load and negative deflection.
- Dimension lines indicating the magnitudes of and .
Figure 7-3 – Clamped Parts Stiffness
In the joint diagram classical analysis the stiffness plots for the two components (fastener and flanges) are combined by inverting Figure 7-3 (in the horizontal axis) and moving its origin such that the preload point is common to both curves until the final preload FV is reached (Reference 7.2).
Figure 7-4 [6.2.3a, b & c)] show the preload increasing during the tightening process.

Figure description:
Text: E CSS Colors: Purple, White Shape: Slanted box divided into two sections, with "E" in a white section and "CSS" in a purple section.
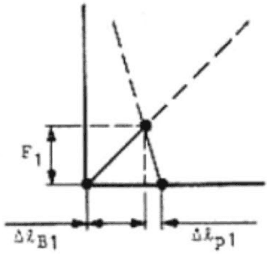
Figure description:
Force-Displacement Diagram
Geometric Representation of Displacement and Force
Annotations
- Primary Intersection Point (text_label - position: Indicated by a dot at height )
- Vertical Axis (vertical_line - position: x = 0)
- Horizontal Axis (horizontal_line - position: y = 0)
- Vertical Projection (vertical_line - position: Dashed line from intersection point to horizontal axis)
- Diagonal Dashed Lines (shaded_area - position: Lines intersecting at the primary dot and extending upwards)
| Label | Description |
|---|---|
| Vertical distance from the horizontal axis to the primary intersection point. | |
| Horizontal distance from the vertical axis to the first point marked on the horizontal axis. | |
| Horizontal distance from the vertical projection of the intersection point to the final point marked on the horizontal axis. |
Notes: The image is a technical schematic showing the relationship between a vertical force or displacement and horizontal displacement parameters and . The diagram includes both solid and dashed lines to represent geometric projections and relationships.
Figure 6.2.3a
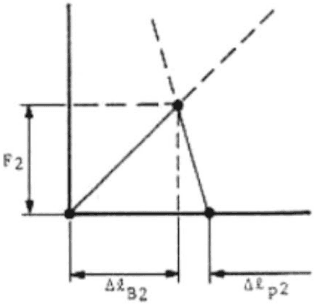
Figure description:
Geometric Triangle Plot
Annotations
- (text_label - position: y-axis dimension from x-axis to peak point)
- (text_label - position: x-axis dimension from origin to peak point projection)
- (text_label - position: x-axis dimension from peak point projection to the third vertex point)
| Point | X-coordinate | Y-coordinate |
|---|---|---|
| Origin | 0 | 0 |
| Peak | ||
| Base Point | 0 |
Notes: The image shows a triangle defined in a 2D coordinate system. Three points are marked with dots: the origin (0,0, a peak at (Delta l_B2, F2, and a third point on the x-axis at (Delta l_B2 + Delta l_p2, 0. Construction lines show the projection of the peak to the axes and extensions of the triangle's sides.)))
Figure 6.2.3b
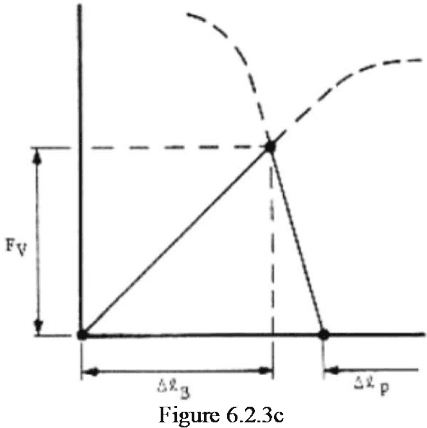
Figure description:
Force-Displacement Diagram for Joint
Figure 6.2.3c
Annotations
- F_V (text_label - position: Vertical dimension from the origin to the intersection point height)
- Δl_B (text_label - position: Horizontal dimension from the origin to the intersection point x-coordinate)
- Δl_P (text_label - position: Horizontal dimension starting from the member x-intercept and extending to the right)
| Point / Feature | x | y | Line Style |\n| :--- | :--- | :--- | :--- |\n| Origin | 0 | 0 | Solid (Dot) |\n| Intersection Point | Δl_B | F_V | Solid (Dot) |\n| Member X-intercept | x_intercept | 0 | Solid (Dot) |\n| Bolt Stiffness Line | 0 to Δl_B | 0 to F_V | Solid |\n| Member Stiffness Line | Δl_B to x_intercept | F_V to 0 | Solid |\n| Horizontal Reference | 0 to Δl_B | F_V | Dashed |\n| Vertical Reference | Δl_B | 0 to F_V | Dashed |\n| Left Behavioral Curve | < Δl_B | > F_V | Dashed |\n| Right Behavioral Curve | > Δl_B | > F_V | Dashed |
Notes: The diagram represents a joint stiffness model, commonly used in mechanical engineering for bolted connections. The solid triangular region represents the interaction of bolt and member stiffnesses, while dashed lines indicate geometric reference points and non-linear behavior curves.
Figure 7-4 - Growth of the Joint Diagram Illustrating the Tightening Process
Applying an external axial load, FA , on the outer surfaces of the joint’s flanges, as shown in Figure 7-5, increases the fastener’s tension and reduces the clamped parts’ compressive loading. This is reflected by the joint diagram in Figure 7-6 with the external force FA represented by a vertical line. The load increments experienced by the fastener and clamped parts when the joint is subjected to FA are given by ∆ b A and ∆ c A respectively.
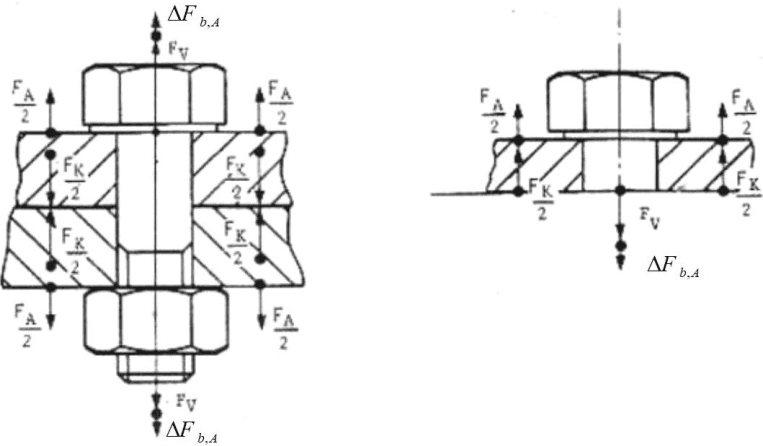
Figure description:
The provided image consists of two technical diagrams illustrating force distributions on a bolted joint:
Entities Visible:
- Fastener: A bolt with a hexagonal head and a nut clamping two flanges together.
- Clamped Parts: Two cross-hatched flanges.
- Forces: Indicated by arrows and mathematical labels.
Key Information and Force Labels:
- : Preload force acting axially along the bolt center.
- : Load increment experienced by the bolt, shown acting in the same direction as the preload.
- : External axial load applied to the outer surfaces of the flanges, split into two components.
- : Compressive clamp force between the flange plates, shown as opposing arrows between the clamped surfaces.
Figure 7-5 – Application of external axial load
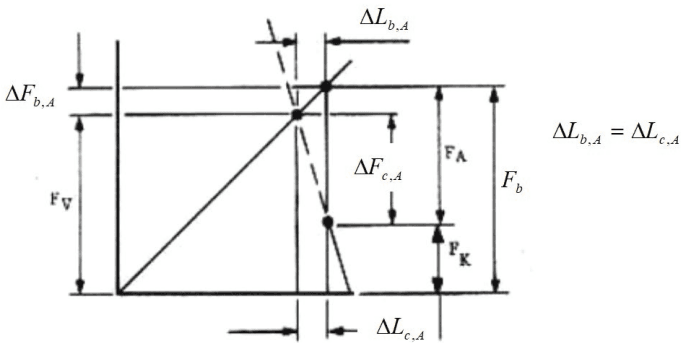
Figure description:
Entities and Variables:
- : Initial preload force on the vertical axis.
- : External axial load, represented by a vertical line segment between the fastener and clamped part lines.
- : Total resultant bolt force.
- : Residual clamping force.
- : Increase in fastener tension due to external load.
- : Decrease in clamped parts' compressive load.
- : Increase in bolt length (extension.
- : Decrease in part compression (rebound.
Key Relationship:
- (The change in length for the bolt and clamped parts is equal.
Diagram Components:
- A solid line with a positive slope representing the bolt's stiffness.
- A solid line with a negative slope representing the clamped parts' stiffness.
- A dashed vertical line showing the transition from the initial state ( to the loaded state (.
Figure 7-6 - Joint Diagram Showing the Effect of an External Axial Load
Figure 7-6 shows that if FA is increased beyond a certain point, FK = 0. This corresponds to the point at which the clamped parts are completely relieved of their preload and gapping at the interface between the flanges occurs, as illustrated in Figure 7-7.
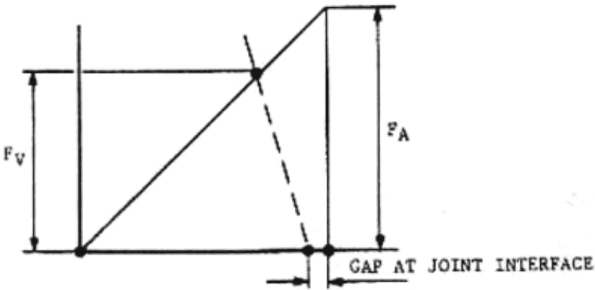
Figure description:
-
Entities:
- Fᵥ: Vertical force/preload represented on the left axis.
- Fₐ: External axial load represented on the right.
- Joint Interface: Indicated along the horizontal axis.
- GAP AT JOINT INTERFACE: Text label and dimension arrows pointing to the horizontal space between two dots.
-
Graphical Elements:
- A solid diagonal line rises from the origin and continues beyond a vertical line.
- A dashed diagonal line descends from an intersection point on the solid line to the horizontal axis.
- The gap is shown as the horizontal distance between the point where the dashed line hits the axis and a vertical line corresponding to force Fₐ.
Figure 7-7 – External Load Causing Gapping
7.3.2 Compressive Loading
If the externally applied axial load on a preloaded joint is compressive, the resulting compression of the flanges and the reduction in bolt tension can be represented on a joint diagram as shown in Figure 7-8. All the equations that were derived for externally applied tensile loads are directly applicable for compressive loads, subject to the correct use of negative signs, (see Reference 7.3).
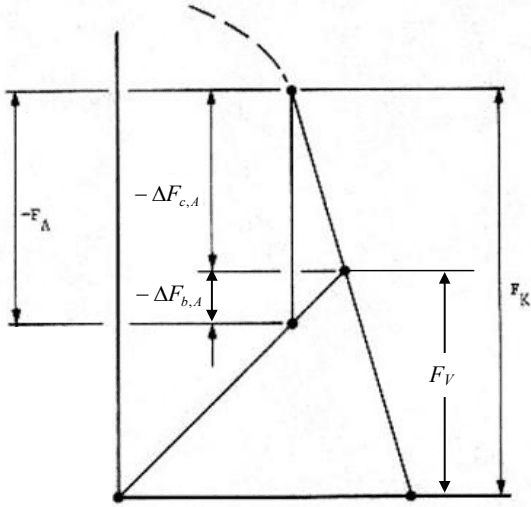
Figure description:
Energy/Force Schematic Diagram
Schematic Diagram of Energy or Force Components
Annotations
- -F_A (text_label - position: leftmost vertical dimension bracket)
- -ΔF_{c,A} (text_label - position: upper portion of the central vertical span)
- -ΔF_{b,A} (text_label - position: lower portion of the central vertical span)
- F_V (text_label - position: vertical height to the intermediate right vertex)
- F_K (text_label - position: total vertical height to the top vertex)
| Dimension Label | Description | Visual Relationship |
|---|---|---|
| F_K | Total height from the baseline to the uppermost vertex. | Corresponds to the maximum vertical extent on the right. |
| F_V | Height from the baseline to the intermediate vertex on the right. | Represents a partial vertical magnitude. |
| -F_A | Total height indicated by the leftmost dimension bracket. | Magnitude is equal to the sum of -ΔF_{c,A} and -ΔF_{b,A}. |
| -ΔF_{c,A} | Vertical distance of the upper segment of the central vertical line. | Measured between the top vertex level and the level of the right-side vertex. |
| -ΔF_{b,A} | Vertical distance of the lower segment of the central vertical line. | Measured between the middle and lower horizontal reference lines. |
Notes: The diagram depicts a geometric decomposition of vertical magnitudes, likely representing thermodynamic free energy (F or forces. The vertical axis represents the magnitude of these terms. The labels with Δ indicate differences or segments that sum up to larger totals. A dashed curve is present at the top-center of the figure, indicating a continuation of the path.)
Figure 7-8 – Joint Diagram for Compressive Loading