6.3.1 The Relation between Torque and Preload
The idealised model used to describe the system of forces in action during tightening assumes the developed shape of the nut thread helix as a “wedge” driven between the 'wedge' of the fasteners thread and surface of the clamped material. The axial result force transmitted by the engaged thread is assumed to act normal to the ideal thread surface at the pitch radius (d2/2). The forces present during tightening are shown in the left of Figure 6-1, and the corresponding wedge model with forces are resolved into a plane is shown on the right of the figure.
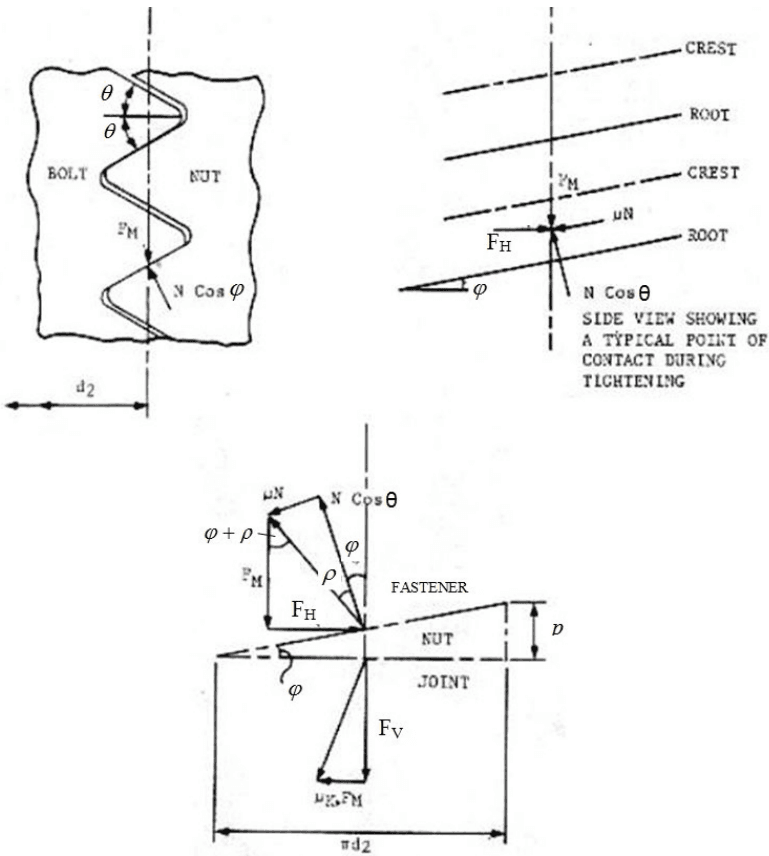
Figure description:
Image Content: Diagrams of forces and geometry during fastener tightening (Wedge Model.
Key Entities:
- Bolt and Nut: Thread interface shown in cross-section.
- Wedge Model: Geometric representation of the thread helix.
- Fastener and Joint: Labels within the lower vector diagram.
Technical Details:
- Dimensions: (pitch radius/diameter reference, (circumference, (pitch.
- Angles: (half-angle of thread, (helix angle, (friction angle, .
- Forces:
- : Horizontal force component.
- : Vertical/Axial force component.
- : Vertical force.
- , : Normal force components.
- , : Friction force components.
- Annotations: "CREST", "ROOT", and "SIDE VIEW SHOWING A TYPICAL POINT OF CONTACT DURING TIGHTENING".
Figure 6-1 – Forces Present During Tightening (the Wedge Model)
From the lower diagram in Figure 6-1 the applied force acting to “slip the wedge” (analogous to rotating the thread) is,
where ϕ is the helix angle of the thread and ρ is given by the relation,
where is the coefficient of friction of the thread interface, and is the half angle of the thread groves.
The torque present at the thread interface is therefore given by,
The ‘under-head’ torque due to friction at the bearing surface between nut or fastener head and the adjacent clamped part is assumed to act at the mean bearing radius of the head (or nut). Therefore, it is given by,
where µ uh is the coefficient of friction between the nut (or fastener head) and the adjacent clamped part, duh is the effective diameter of the under-head friction torque as defined by equation [5.4.6], and λ is the under-head bearing angle (see Figure 5-6).
Thus, the total installation torque applied (to either the head or nut) during tightening in order to produce the preload FV is,
where MP is the prevailing torque (self-locking torque) of the locking device (see Section 6.3.3). In case of highly preloaded joints, MP can be ignored; however in such a case, a demonstration that MP does not contribute to preload reduction shall be provided.
MP is subject to scatter so, in addition to quoting mean values, an indication of its expected variation is given by either the range or coefficient of variation. Mp is likely to vary with fastener size. Section 6.3.3 contains more information about locking devices and Table 6-2 provides some experimental data.
A second approach in industry applied to critical joints is to measure the prevailing torque of each self locking insert, wire thread insert, nut, add the value to the established seating torque and install the fastener with the combined torque. It is important that the measured prevailing torque is within the range given by the insert, wire thread insert, nut manufacturer.
Figure description:
Key Entity: ECSS
- Text: E CSS
- Format: Italicized letters within a parallelogram divided into two color sections.
- Color Scheme: The letter "E" is blue on a white background. The letters "CSS" are white on a blue background.
The geometric relation,
with the approximation , gives,
Hence, [6.3.5] can be rewritten as,
or using the geometric relation
The applied torque Equation [6.3.10] can be separated into the following terms:
representing the torque absorbed in stretching the fastener, representing the torque due to friction in the threaded interface, representing the torque due friction under the nut (or head), and representing the prevailing torque due to the locking device
A typical distribution of the torque between these components is as follows:
- • 10% Stretching bolt
- • 30% Absorbed by friction in threads
- • 50% Absorbed by friction under head of bolt or nut
- • 10% Prevailing torque of a self-locking thread
The following simplified expression for can be used for the common case of Unified or Metric threads (where ) and standard heads (where ),
In practice manufacturing variations in , and are negligible. Thus, for a geometrically similar fastener system, depends primarily on variations in and . If, for a given joint, the friction coefficients are fixed, the torque to preload relationship is linear.
6.3.2 Determining the Design Torque Level
6.3.2.1 Overview
Excessive fastener torque can lead to tensile failure of the fastener. On the other hand, insufficient torque can lead to inadequate compression of the clamped parts, leading to failure by gapping or to slipping (when slipping is not allowed).
The specified torque range is normally found by an iterative design process whereby the margins of safety are calculated for each relevant failure mode.
It is important to first calculate the maximum and minimum applied torques, Mapp,max and Mapp,min , taking into account the torque measurement accuracy. The most common way to specify these torque levels is to calculate them relative to a nominal applied torque, Mnom . Annex A recommends starting values of nominal torque, Mapp,nom , for some of the most commonly used fasteners.
Two methods are presented in sections 6.3.2.2 and 6.3.2.3 for calculating the preload range based on the torque range:
- a. Experimental Coefficient Method, and
- b. Typical Coefficient Method.
It is important to apply the Experimental Coefficient Method whenever the preload in the joint is critical (e.g. for friction grip joints) since it considers independently the uncertainties of the fastener friction coefficients and torque wrench accuracy.
The Typical Coefficient Method is mostly used in cases where control of the preload is non-critical. This occurs most often for bearing joints or low-duty joints.
6.3.2.2 The Experimental Coefficient Method
This method takes into account all sources of preload uncertainty, namely the prevailing torque, preload loss due to embedding, thermo-elastic effects, and the torque wrench accuracy.
Firstly, the maximum and minimum bounds of the applied torque, Mapp,min and Mapp,min are determined by,
where Mnom is the nominal applied torque (normally determined by an iterative process) and ω is the torque wrench accuracy, which is typically in the range ±5% to ±15%.
It is important to guarantee the torque wrench accuracy by certificates obtained during periodic calibrations.
Next, the maximum and minimum preloads are found by the following equations, which are derived from Equation [6.3.10], and modified to include thermal and embedding effects:

Figure description:
Entity: Table 6-1 - Uncertainty factors of tightening methods (from reference 5.1
Data:
- Tightening method: Torque control
- Condition: lubricated; Uncertainty factor : 0.15 - 0.20
- Condition: unlubricated; Uncertainty factor : 0.25 - 0.35
- Condition: cadmium plated (*; Uncertainty factor : 0.20
- Tightening method: Angle control; Uncertainty factor : 0.10
- Tightening method: Yield control; Uncertainty factor : 0.08
- Tightening method: Ultrasonic measurement; Uncertainty factor : 0.05
- Tightening method: Strain gauges; Uncertainty factor : 0.01
where F ∆T + and F ∆T − are the maximum (most positive) and minimum (most negative) increments in the fastener load due to thermo-elastic effects (see Section 6.3.5), and FZ is the maximum preload loss due to relaxation (see Section 6.4).
The term MP,min in Equation [6.3.14] is relatively insignificant and, as a conservative simplification, is often excluded from the calculation.
The minimum preload calculated by Equation [6.3.15], includes the preload loss due to relaxation, FZ . This term does not appear in the maximum preload equation [6.3.14] since embedding can only loosen a fastener, and therefore cannot increase the maximum preload.
6.3.2.3 The Typical Coefficient Method
In this method an uncertainty factor is introduced to account for all sources of scatter observed during the tightening process. The friction coefficients used are nominal (or average) values.
The Equations [6.3.17] and [6.3.18] separate the applied torque into its minimum and maximum values, Mapp,max and Mapp,min . However, since the preload scatter is dominated by friction variability, in many cases it is equally conservative to use the nominal applied torque, Mapp,nom , in both of these equations.
Table 6-1 gives typical values of ε for a range of tightening.
| Method of preload application | Uncertainty factor (ε ) |
|---|---|
| Torque measurement of unlubricated bolts | ± 0,35 |
| Torque measurement of cadmium-plated bolts (*) | ± 0,30 |
| Torque measurement of lubricated bolts | ± 0,25 |
| Hydraulic fasteners | ± 0,15 |
| Preload indicating washers | ± 0,10 |
| Ultrasonic measurement devices | ± 0,10 |
| Bolt elongation measurement | ± 0,05 |
| Instrumented bolts | ± 0,05 |
NOTE(*) This information is provided for reference only, since the use of cadmium- plated fasteners is not allowed
The uncertainty factor can be reduced when the preload is measured by more accurate methods such as those discussed in Section 12, or sometimes also by increasing the accuracy of the torque wrench.
6.3.3 Locking Devices and Prevailing Torque
A joint in a spacecraft is exposed to extensive vibration loads during the launch phase of its mission. Therefore, it is important that all joints with threaded fasteners have locking devices to avoid vibration loosening. Locking can be realised by either self-locking threads (applicable to both nuts and helicoils or inserts) or by other means such as adhesives , lock wire or highly preloaded bolted junctions.
Self-locking thread devices commonly used in spacecraft can be put in three categories:
- • Helicoil (screwlock) or insert: The locking is achieved by one or several deformed threads located in the threaded hole.
- • Self-locking nuts: The nuts cross section is deformed to an elliptical shape and has to be reshaped to a circle when screwing through it.
- • Self-locking anchor nuts: The locking mechanism is the same as self-locking nuts but the nut is anchored to the flange.
A variety of other self-locking thread devices exist for terrestrial applications; plastic thread inserts, etc.
To rely on the high preload as locking mechanism it is very important, that the desired preload is applied to the bolted junction, which is usually done by dedicated Quality Assurance measures.
Before the fastener can rotate it is necessary to overcome a certain torque, named the prevailing torque. This is measured by turning the threaded parts while there is neither under-head nor under-nut contact. This practice is recommended for every safety-critical fastener, which has a self-locking device.
The prevailing torque of some commonly manufactured devices meeting LN norms are listed in Table 6-2. If an adhesive is used to guarantee locking of the threaded parts, it is important that tests are performed to determine its prevailing torque. It is important to note that liquid adhesives are known to act as a lubricant prior to curing, so a lower friction coefficient is used when determining the preload torque. Also, the use of liquid adhesives as locking mean is not recommended since its effect cannot be verified during the installation of the fastener (the inferred locking torque cannot be measured).
| Fastener Type | Type of Nut or Insert | Size | Mp,min [Nm] | Mp,max [Nm] | Mp,av [Nm] |
|---|---|---|---|---|---|
| Cylinder-head fastener, LN 29949 | Helicoil (screwlock) bronze (not cadmium plated), LN 9499 [1] | M4 | -[2] | - | - |
| M5 | 1,10 | 1,60 | 1,28 | ||
| M6 | 2,60 | 4,60 | 3,36 | ||
| M8 | 4,40 | 5,60 | 4,91 | ||
| Anchornut, LN 29693 | M4 | - | - | - | |
| M5 | - | - | - | ||
| M6 | 0,40 | 2,00 | 1,47 | ||
| M8 | - | - | - | ||
| Nut, LN 9161-M | M4 | - | - | - | |
| M5 | 1,10 | 2,00 | 1,56 | ||
| M6 | 0,50 | 1,00 | 0,66 |
NOTE [1] LN 9499 is only applicable for CRES helicoils. DIN 65536-1 is the correct standard for bronze helicoils.
NOTE [2] In many cases data can be requested from the insert, wire thread insert, nut manufacturer.

Figure description:
Figure 6-2: Preload scatter as a function of torque and friction
Key Entities and Information:
- X-axis: Assembly torque [Nm, indicating values , , and .
- Y-axis: Preload [N, indicating values and .
- Friction Coefficient ( Slopes:
- (steepest slope
- (shallowest slope
- Key Data Points:
- Point X: Intersection of maximum assembly torque ( and minimum friction (, representing maximum preload . It is located at the "90% preload yield" limit.
- Point Y: Intersection of minimum assembly torque ( and maximum friction (, representing minimum preload .
- Preload Limit: A horizontal dashed line indicates "90% preload yield".
- Scatter Area: The region bounded by the and lines between and illustrates the possible variation in preload.
When using Table 6-2 some additional information need to be considered. Generally, helicoils (screwlock) as defined in LN 29949 show the largest statistical spread of self-locking torque with the most and largest outlier values. These outliers are not taken into account in the table. Uncommonly high values for the prevailing torque normally indicate a failure of the helicoil.
Table 6-2 is given as reference only. The reader is addressed to look into the data sheets published by the manufacturers of self-locking wire thread inserts, inserts and nuts. They usually provide the minimum and maximum values of the self-locking torque for each thread size. It is necessary to measure the actual value of the self-locking torque during the fastener installation process, and to check that it is within the limits provided by the manufacturer.
To avoid galling, it is recommended that the helicoils are made from bronze CuSn6 material number 2.1020.34.
For additional best practise guidelines for various locking features refer to Annex B of reference 6.1.
6.3.4 Sources of Error
Referring to Equation [6.3.10], the dominant factor contributing to scatter in the torque vs. preload relationship is the variability in the friction conditions.
Variations in fastener geometry that influence the friction radii can also contribute to scatter but to a lesser extent. Of these, variations in the under-head and under-nut radii are most dominant.
In addition, variation in the applied assembly torque can also contribute to scatter.
Prevailing torque scatter also contributes to the variation in the effective assembly torque seen by the fastener. To minimise this effect it is important that the torque applied to each fastener is adjusted by its (measured) prevailing torque, which is measured while turning the threaded parts prior to contact at the under-head or under-nut interfaces.
The effect of these factors on the possible scatter in the fastener preload is shown in Figure 6-2. This illustrates the dominant effect of friction and demonstrates the high scatter possible if friction conditions are not controlled by the careful specification and application of lubrication.
Figure 6-2 shows an example of the preload as a function of the applied torque. The relationship is linear and the slope depends on the friction coefficients. The graph shows contours of the fastener stress ratio, , which indicate the strength utilisation.
The maximum preload, 90% of the fastener yield load, is found at the point X, where the maximum thread torque Mth,max and minimum friction µ min occur. The minimum preload load FV,min is found at the point Y where the minimum thread torque Mth,min and maximum friction coefficient µ max occur.
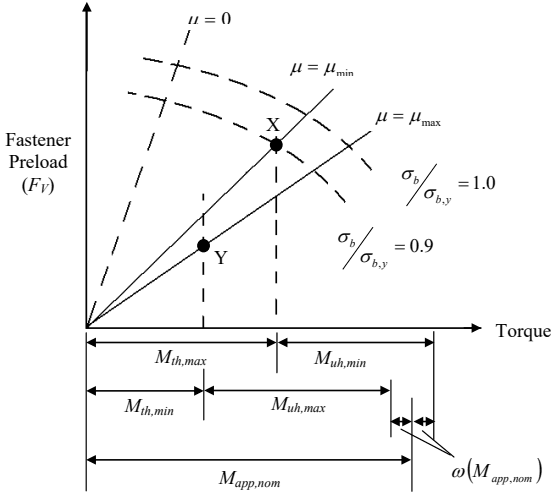
Figure description:
Fastener Preload and Torque Relationship Diagram Analysis of friction coefficients (μ and stress ratios (σ_b/σ_b,y
Fastener Preload (F_V vs. Torque
Legend
- μ = 0 — color: black; symbol: Dashed line
- μ = μ_min — color: black; symbol: Solid line
- μ = μ_max — color: black; symbol: Solid line
- σ_b/σ_b,y = 1.0 — color: black; symbol: Dashed curved line
- σ_b/σ_b,y = 0.9 — color: black; symbol: Dashed curved line
Annotations
- Point X (text_label - position: Intersection of μ = μ_min and σ_b/σ_b,y = 1.0)
- Point Y (text_label - position: Intersection of μ = μ_max and σ_b/σ_b,y = 0.9)
- Total Torque Range (shaded_area - position: M_app,nom ± ω(M_app,nom aligns with the extremes of the friction cases))
| Feature | Label / Series | Description | Relationship |
|---|---|---|---|
| Y-axis | Fastener Preload | Dependent variable | |
| X-axis | Torque | Applied Torque | Independent variable |
| Line | Theoretical zero-friction line | Highest preload/torque ratio | |
| Line | Minimum friction coefficient line | Passes through Point X | |
| Line | Maximum friction coefficient line | Passes through Point Y | |
| Curve | Yield stress limit curve | Upper safety limit | |
| Curve | 90% yield stress limit curve | Lower design limit | |
| Point | X | Intersection of and yield limit | Defined by preload |
| Point | Y | Intersection of and 90% yield limit | Defined by preload |
| Dimension | Max thread torque component | Distance from origin to X's projection | |
| Dimension | Min under-head torque component | Distance from X's projection to upper torque limit | |
| Dimension | Min thread torque component | Distance from origin to Y's projection | |
| Dimension | Max under-head torque component | Distance from Y's projection to lower torque limit | |
| Dimension | Nominal applied torque | Target torque value | |
| Dimension | ) | Applied torque tolerance | Uncertainty range for |
Notes: The chart illustrates the components of total torque (thread torque M_th and under-head torque M_uh and how friction variations and stress limits define the allowable preload window for a fastener.)
Figure 6-2 - Typical Preload vs. Applied Torque Graph
Regarding Figure 6-2 it is important to note that the applied torque is deterministic, i.e. the frictional torques acting on the fastener always add up to the externally applied toque, Mapp . This means that the extreme preload conditions occur under the following conditions:
- • Maximum preload - minimum thread friction and minimum under-head friction
- • Minimum preload – maximum thread friction and maximum under-head friction
The joint in Figure 6-2 has no prevailing torque device. This is evidenced by the fact that the torque is zero when the preload is zero. Including a prevailing torque element shifts the curves to the right of this graph.
6.3.5 Forces Induced by Thermal Fluctuation
6.3.5.1 Overview
During thermal fluctuations the preload changes due to differing thermal expansion coefficients of the fastener and flange material. Also, the modulus of elasticity of the materials can be temperature sensitive.
The thermal expansion coefficient relates the elongation of an individual item with the length , to a temperature difference according to,
where is the item's coefficient of thermal expansion and
Assuming clamped parts made from a single material type, the respective elongations of the fastener and clamped parts are,
where Lj is the joint length (equal to the combined thickness of all clamped parts), and α b α are the c coefficients of thermal expansion of the fastener and clamped parts respectively.
Based on the above equations, it can be shown that the thermally induced load (in the fastener) is given by,
Note that this formula assumes that the Young modules is not varying with temperature and dT for bolt and parts are identical.
The extreme values of the thermally induced force are denoted and , and these are given by the higher and lower results of,
where the temperature differentials are given by,
6.3.5.2 Clamped Parts made from Multiple Material Types
If the clamped parts have multiple material types, it is important to use a more general form of Equation [6.3.23] to account for the differing thermal expansion coefficients,
where α c, i is the thermal expansion coefficient of the i’th clamped part, Lc,i is the length of the i'th clamped part and m is the total number of clamped parts.
It can be shown that this equation leads to the following equation for the thermally induced load in the fastener,
6.3.5.3 Temperature Dependent Modulus of Elasticity
In some cases it can be necessary to consider the variation of the modulus of elasticity with changes in temperature. When it is important to take into account this dependency, the thermally induced load can be calculated by the following equation that assumes a linear variation of E with temperature:
where; and are the moduli of elasticity of the fastener at the reference temperature and working temperature respectively, and and are the moduli of elasticity of the clamped parts at the reference temperature and working temperature respectively, and and are the compliances of the fastener and clamped parts respectively (see Section 7).