11.2.1 Fundamentals
Fatigue failure occurs in a material under the cumulative effect of a number of cycles of alternating, repeated or varying stresses (usually tensile) of a level lower than the maximum static failure (or yield) stress. Such failures occur due to progressive extension of a micro crack initiating at the point of highest stress in a local stress field.
The initial speed of extension of the crack, after its initiation, is dependent on the crack propagation properties of the material and the applied loading cycle. Eventually a point of rapid and unstable crack growth occurs resulting in ultimate failure of the fastener.
The number of cycles to failure decreases as the range of alternating stress increases. For some materials an indefinitely long crack free life can be expected provided that the range of alternating stress is sufficiently low. However, some materials (such as Aluminium alloy) have no fatigue limit, although
1 Fatigue Crack Growth Computer Program, originally developed at NASA Johnson Space Center, now further developed by Southwest Research Institute and the NASGRO Consortium.
the slope at high values of N becomes very low. A typical alternating stress versus number of cycles to failure (S-N) curve is shown in Figure 11-1. The S-N curve approach generally assumes that the crack initiation time is much longer than the time to propagate the crack to failure.

Figure description:
Fatigue Life Characteristics
S-N Curve: Alternating Stress vs. Cycles to Failure
Legend
- MEAN — color: black; symbol: Solid line
- SCATTER boundaries — color: black; symbol: Dashed line
Annotations
- MEAN FATIGUE STRENGTH AT 10^3 CYCLES (text_label - position: y-axis level at x = 10^3 on the mean curve)
- MEAN FATIGUE LIMIT (ASYMPTOTE (horizontal_line - position: y ≈ 26 (Relative Units)))
- SCATTER (shaded_area - position: Region between the dashed lines)
| N Cycles to Failure | Mean Alternating Stress (Relative Units) | Upper Scatter Boundary (Relative Units) | Lower Scatter Boundary (Relative Units) |
|---|---|---|---|
| 10^1 | 80 | 92 | 68 |
| 10^2 | 75 | 87 | 63 |
| 10^3 | 68 | 80 | 56 |
| 10^4 | 50 | 65 | 35 |
| 10^5 | 35 | 50 | 20 |
| 10^6 | 28 | 42 | 15 |
| 10^7 | 26 | 40 | 12 |
Notes: The y-axis 'Alternating Stress σa' does not have numerical labels; relative values were estimated to represent the curve's shape. The x-axis 'N Cycles to Failure' is on a logarithmic scale from 10^1 to 10^7. The scatter band indicates statistical variability around the mean fatigue life.
Figure 11-1 - Typical Fatigue Curve at Constant Mean Stress
An increase of the mean stress level reduces the alternating stress that causes failure. Figure 11-2 shows a typical constant amplitude loading and Figure 11-3 shows the effect of changed mean stress.

Figure description:
Definitions of Stress Parameters in Cyclic Loading
Stress vs Time Waveform
Annotations
- 1 CYCLE (horizontal_interval - position: Horizontal distance for one complete period)
- σ_a (vertical_interval - position: Vertical distance from mean stress line to peak)
- σ_a (vertical_interval - position: Vertical distance from mean stress line to trough)
- σ_m (vertical_interval - position: Vertical distance from 0 axis to dashed mean stress line)
- σ_max (vertical_interval - position: Vertical distance from 0 axis to top peak)
- -σ_min (vertical_interval - position: Vertical distance from 0 axis to bottom trough)
- Mean Stress Line (dashed_line - position: y = σ_m)
| Time | Stress |
|---|---|
| 0 | σ_m |
| 0.25 Cycle | σ_max |
| 0.5 Cycle | σ_m |
| 0.75 Cycle | σ_min |
| 1 Cycle | σ_m |
Notes: The diagram identifies key parameters of cyclic stress loading: maximum stress (σ_max, minimum stress (σ_min, mean stress (σ_m, and stress amplitude (σ_a. One cycle is defined as the period of the repeating sinusoidal waveform.))))
Figure 11-2 - Typical Constant Amplitude Loading

Figure description:
Fatigue Constant Life Diagram for Variable Mean Stresses (Haas–Gurney Diagram or modified Goodman/Gerber variant schematic.
Haas-Gurney Constant Life Diagram
Legend
- N = 1.0 — symbol: Outermost solid straight line boundary
- N = 10^3 — symbol: Solid curve
- N = 10^4 — symbol: Solid curve
- N = 10^5 — symbol: Solid curve
- N = 10^6 — symbol: Solid curve
- N = 10^7 — symbol: Solid curve
Annotations
- R = -1 (vertical_line - position: Vertical axis where Ᾱm = 0)
- R = 0 (radial_line - position: Ray through origin where Ᾱa = Ᾱm)
- R = 1 (horizontal_line - position: Horizontal axis where Ᾱa = 0)
- R = -∞ (radial_line - position: Ray through origin into compression region where Ᾱa = -Ᾱm)
- LINES OF CONSTANT MEAN STRESS (vertical_line - position: Indicated by dashed vertical line Ᾱm)
- LINES OF CONSTANT R (radial_line - position: Indicated by dashed ray from origin)
- COMPRESSION (text_label - position: Region to the left of the vertical axis)
- TENSION (text_label - position: Region to the right of the vertical axis)
- Ᾱmin = -Ᾱc (text_label - position: Bottom left corner)
- Ᾱmax = Ᾱb (text_label - position: Bottom right corner)
| Mean Stress (Ᾱm) | Alternating Stress Ᾱa (N=1.0) | Ᾱa (N=10³) | Ᾱa (N=10⁴) | Ᾱa (N=10⁵) | Ᾱa (N=10⁶) | Ᾱa (N=10⁷) |
|---|---|---|---|---|---|---|
| Ultimate Compressive Strength (Ᾱc) | 0 | null | null | null | null | null |
| 0 (Zero Mean Stress) | Peak Value | 0.75 * Peak | 0.60 * Peak | 0.48 * Peak | 0.38 * Peak | 0.30 * Peak |
| Ultimate Tensile Strength (Ᾱb) | 0 | 0 | 0 | 0 | 0 | 0 |
Figure 11-3 - Typical Stress Ratio – Mean Stress Diagram
Provided the combination of alternating and mean stresses does not exceed the fastener yield stress, a high initial preload is beneficial to the fatigue crack initiation resistance of the fastener. This is illustrated in Figure 11-4. Even very high tensile stresses, which cause plastic deformation at local stress concentrations, can be beneficial. Plastic deformation results in residual compressive stresses, which reduce the effective stress.
The ESAFATIG software (reference 11.2) contains specific fastener data. The available fastener data is illustrated below in Figure 11-5 to Figure 11-8.
where:
See reference 11.2 for more details.

Figure description:
Fatigue Strength Curves for Different Preload Levels
AXIAL STRESS vs CYCLES
Legend
- PRELOAD 90% σ₀.₂ — color: black; symbol: Solid line
- PRELOAD 50% σ₀.₂ — color: black; symbol: Solid line
- PRELOAD 10% σ₀.₂ — color: black; symbol: Solid line
Annotations
- Threshold 0.85 (as fraction of 100% preload (text_label - position: y = 1190))
- Threshold 0.41 (as fraction of 100% preload (text_label - position: y = 574))
- Threshold 0.20 (as fraction of 100% preload (text_label - position: y = 280))
| Cycles | PRELOAD 90% σ₀.₂ (N/mm²) | PRELOAD 50% σ₀.₂ (N/mm²) | PRELOAD 10% σ₀.₂ (N/mm²) |
|---|---|---|---|
| 10³ | 1400 | 1400 | 1400 |
| 10⁴ | 1350 | 1250 | 1150 |
| 10⁵ | 1220 | 950 | 750 |
| 10⁶ | 1150 | 600 | 350 |
| 10⁷ | 1120 | 574 | 280 |
Notes: The x-axis represents cycles on a logarithmic scale. The right-hand axis indicates the threshold value as a fraction of the 100% preload (which is 1400 N/mm².)
Figure 11-4 - Typical Preload Effects on Fatigue Life of Fasteners (taken from reference 11.6)
Material Group: stainless steel [d] Material Alloy: A286 --[1] Material Description: [d1] A-286, STA d=3/16'' p:32/inch NAS-6703-12M screw R=(0.
Material Data - Fatigue Curvefit Constants :
| P: | 0.483 | A: | 14.545 | B: | 3.722 | C: | 180.000 | L: | 180.000 | UTS: | 1100 | YS: | 950 | Sexp: | 950 |
|---|
(a)
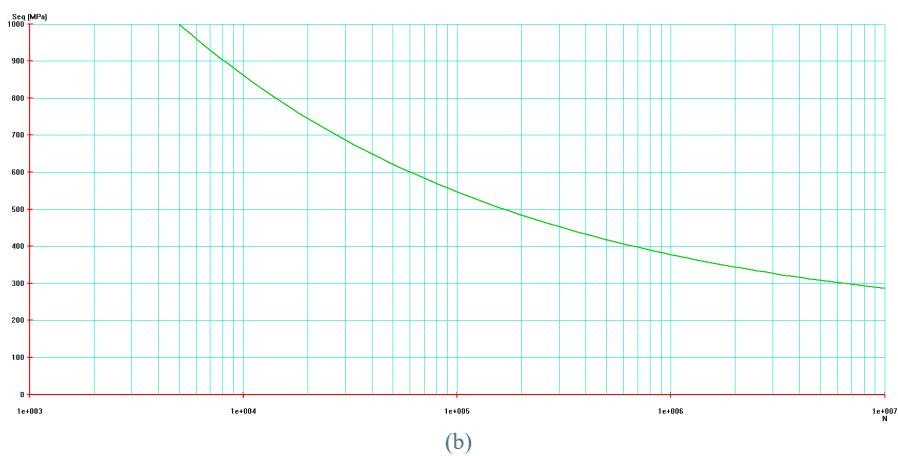
Figure description:
(b
| N | Seq [MPa |
|---|---|
| 5.5e+003 | 1000 |
| 1e+004 | 820 |
| 2e+004 | 690 |
| 3e+004 | 610 |
| 4e+004 | 560 |
| 5e+004 | 530 |
| 1e+005 | 450 |
| 2e+005 | 390 |
| 3e+005 | 360 |
| 4e+005 | 340 |
| 5e+005 | 330 |
| 1e+006 | 305 |
| 2e+006 | 285 |
| 5e+006 | 260 |
| 1e+007 | 245 |
Notes: The chart shows a fatigue S-N curve with Seq [MPa on a linear y-axis and N on a logarithmic x-axis.
Material Group : stainless steel [d] -> Material Alloy : A286 ---[1] -> Material Description : [d1] A-286, STA d=3/16'' p:32/inch NAS-6703-12M screw R=(0. ->
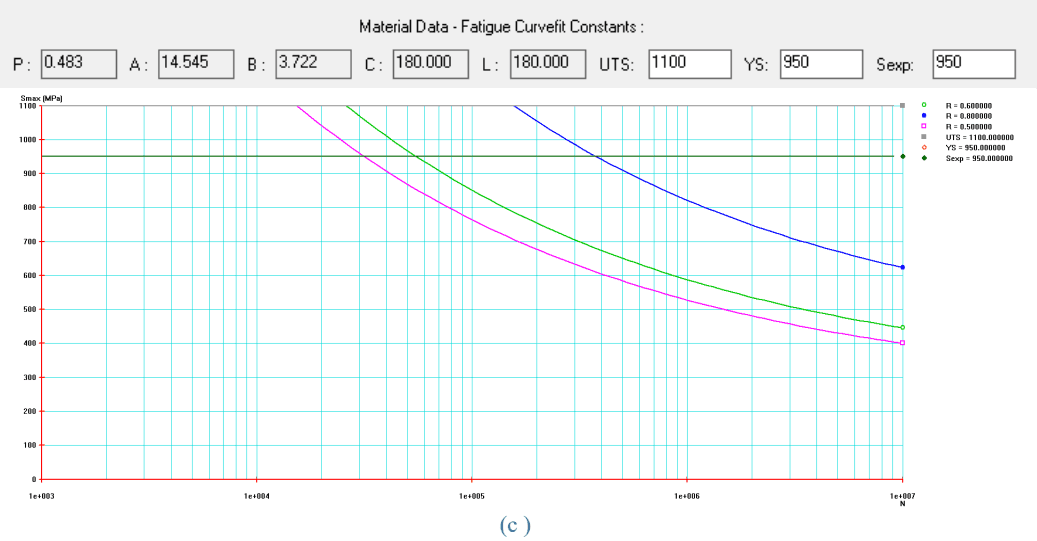
Figure description:
Material Data - Fatigue Curvefit Constants
Fatigue Curvefit: Smax vs N
Legend
- R = 0.600000 — color: green; symbol: circle
- R = 0.800000 — color: blue; symbol: solid square
- R = 0.500000 — color: magenta; symbol: open square
- UTS = 1100.000000 — color: grey; symbol: solid square
- YS = 950.000000 — color: orange; symbol: open diamond
- Sexp = 950.000000 — color: dark green; symbol: solid diamond
Annotations
- UTS = 1100.000000 (horizontal_line - position: y = 1100)
- YS = 950.000000 (horizontal_line - position: y = 950)
- Sexp = 950.000000 (horizontal_line - position: y = 950)
| N (Cycles) | Smax (MPa [R=0.500000) | Smax (MPa [R=0.600000) | Smax (MPa [R=0.800000) | UTS (MPa) | YS (MPa) | Sexp (MPa) |
|---|---|---|---|---|---|---|
| 1.00E+03 | 1100 | 950 | 950 | |||
| 1.00E+04 | 1100 | 950 | 950 | |||
| 1.50E+04 | 1100 | 1100 | 950 | 950 | ||
| 2.50E+04 | 1000 | 1100 | 1100 | 950 | 950 | |
| 3.00E+04 | 950 | 1050 | 1100 | 950 | 950 | |
| 5.00E+04 | 870 | 950 | 1100 | 950 | 950 | |
| 1.00E+05 | 720 | 820 | 1100 | 950 | 950 | |
| 1.80E+05 | 650 | 730 | 1100 | 1100 | 950 | 950 |
| 4.00E+05 | 580 | 650 | 950 | 1100 | 950 | 950 |
| 1.00E+06 | 520 | 580 | 820 | 1100 | 950 | 950 |
| 1.00E+07 | 400 | 450 | 620 | 1100 | 950 | 950 |
Notes: Curvefit Constants: P: 0.483, A: 14.545, B: 3.722, C: 180.000, L: 180.000, UTS: 1100, YS: 950, Sexp: 950. X-axis (N represents the number of cycles on a log scale. Y-axis (Smax represents maximum stress in MPa on a linear scale.))
(a) Model parameters; (b) Seq-N; (c) Smax-N (for R=0.5, 0.6, 0.8)
Figure 11-5 – ESALOAD S-N curves for A286 steel bolts (UTS=1100MPa)
Material Group : stainless steel [d] -> Material Alloy : A286 ---[1] -> Material Description : [d2] A-286 M5, W. No. 1.4944.4 screw R=(0.04;0.65) -> Material Data - Fatigue Curvefit Constants : P : 0.780 A : 18.316 B : 4.964 C : 0.000 L : 119.719 UTS: 960 YS: 660 Sexp: 845
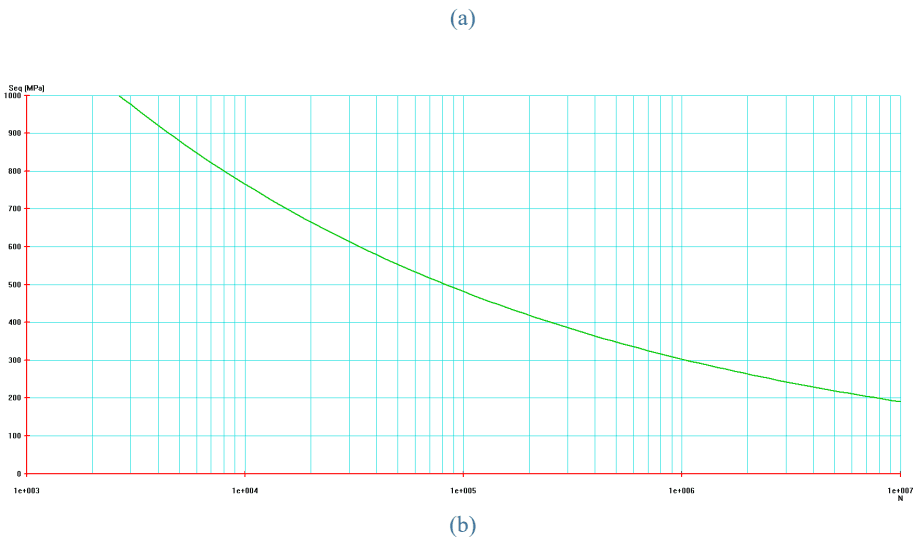
Figure description:
(a
| N (Cycles) | Seq [MPa |
|---|---|
| 2.1E+03 | 1000 |
| 4.0E+03 | 920 |
| 6.0E+03 | 860 |
| 8.0E+03 | 815 |
| 1.0E+04 | 780 |
| 2.0E+04 | 660 |
| 3.0E+04 | 610 |
| 4.0E+04 | 570 |
| 5.0E+04 | 540 |
| 6.0E+04 | 525 |
| 8.0E+04 | 500 |
| 1.0E+05 | 480 |
| 2.0E+05 | 420 |
| 3.0E+05 | 390 |
| 4.0E+05 | 370 |
| 5.0E+05 | 350 |
| 6.0E+05 | 335 |
| 8.0E+05 | 315 |
| 1.0E+06 | 300 |
| 2.0E+06 | 260 |
| 3.0E+06 | 245 |
| 4.0E+06 | 230 |
| 5.0E+06 | 220 |
| 6.0E+06 | 215 |
| 8.0E+06 | 200 |
| 1.0E+07 | 190 |
Notes: The chart is an S-N curve showing equivalent stress (Seq in MPa versus the number of cycles (N. The x-axis is on a logarithmic scale from 1e+003 to 1e+007.))

Figure description:
Fatigue S-N Curves
(c
Legend
- R = 0.500000 — color: green; symbol: open circle
- R = 0.040000 — color: blue; symbol: solid circle
- R = 0.650000 — color: magenta; symbol: open square
- UTS = 960.000000 — color: grey; symbol: solid square
- YS = 660.000000 — color: orange; symbol: open diamond
- Sexp = 845.000000 — color: dark green; symbol: solid diamond
| N | Smax [MPa (R = 0.500000) | Smax [MPa (R = 0.040000) | Smax [MPa (R = 0.650000) | UTS | YS | Sexp |
|---|---|---|---|---|---|---|
| 1.00E+03 | null | null | null | 960.0 | 660.0 | 845.0 |
| 2.00E+03 | null | 1000.0 | null | 960.0 | 660.0 | 845.0 |
| 5.00E+03 | null | 900.0 | null | 960.0 | 660.0 | 845.0 |
| 1.00E+04 | null | 780.0 | null | 960.0 | 660.0 | 845.0 |
| 2.00E+04 | null | 660.0 | null | 960.0 | 660.0 | 845.0 |
| 5.00E+04 | 1000.0 | 560.0 | null | 960.0 | 660.0 | 845.0 |
| 1.00E+05 | 780.0 | 480.0 | null | 960.0 | 660.0 | 845.0 |
| 2.00E+05 | 680.0 | 430.0 | 980.0 | 960.0 | 660.0 | 845.0 |
| 5.00E+05 | 560.0 | 360.0 | 820.0 | 960.0 | 660.0 | 845.0 |
| 1.00E+06 | 480.0 | 300.0 | 710.0 | 960.0 | 660.0 | 845.0 |
| 5.00E+06 | 360.0 | 230.0 | 520.0 | 960.0 | 660.0 | 845.0 |
| 1.00E+07 | 325.0 | 200.0 | 435.0 | 960.0 | 660.0 | 845.0 |
Notes: The chart displays S-N (Stress vs. Number of cycles fatigue curves for three different stress ratios (R = 0.04, 0.50, and 0.65. The x-axis is a logarithmic scale for the number of cycles N. Three reference horizontal lines are shown for UTS (960 MPa, YS (660 MPa, and an experimental stress level Sexp (845 MPa.)))))
(a) Model parameters; (b) Seq-N; (c) Smax-N (for R=0.04, 0.5, 0.65)
Figure 11-6 – ESALOAD S-N curves for A286 steel bolts (UTS=960MPa)
Material Group : stainless steel [d] -> Material Alloy : A2-80 SCREW ---[2] -> Material Description : [a1] A2-80, M5, ISO 3506-1979 austenitic screw R=(0.6;0.8) ->
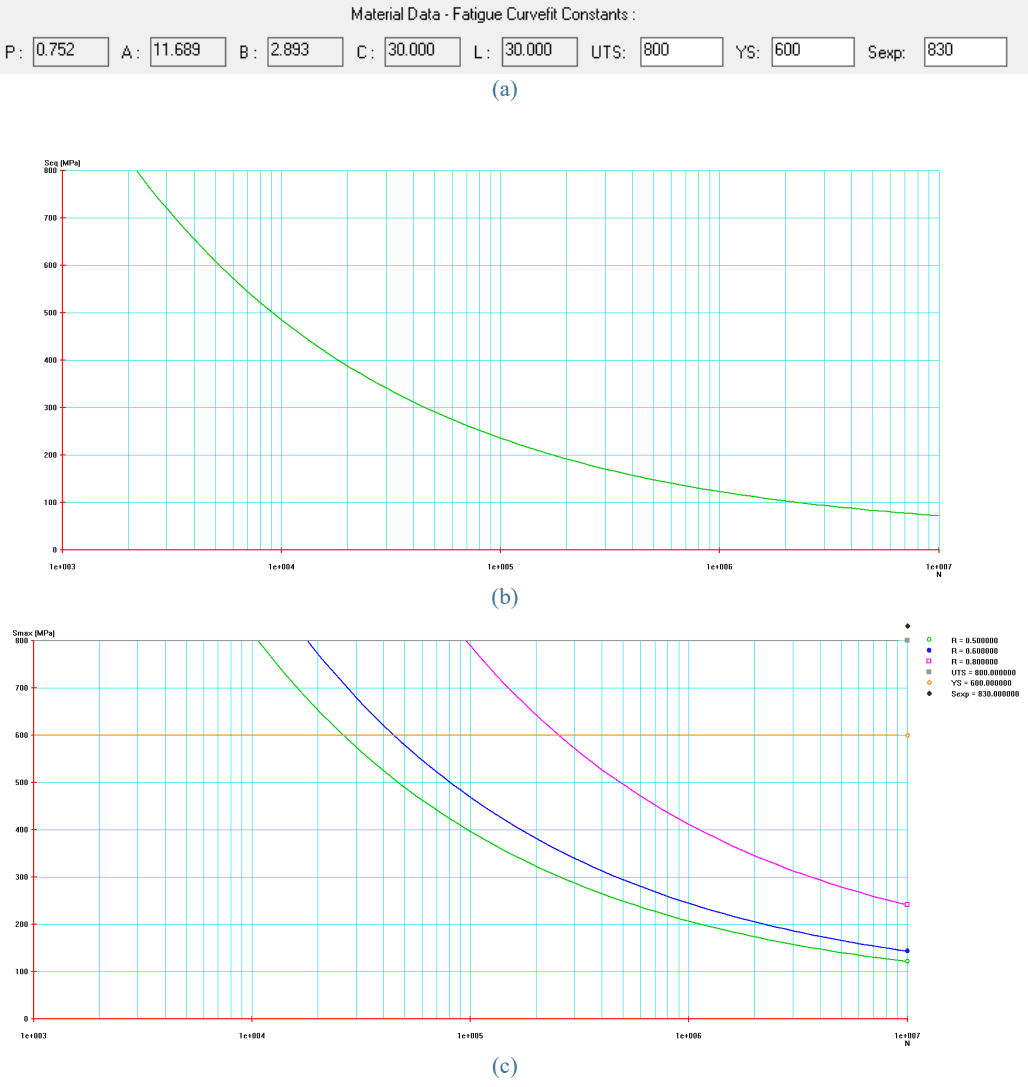
Figure description:
Material Data - Fatigue Curvefit Constants (a Fatigue Curvefit Constants, (b Seq vs N, (c Smax vs N for various R ratios
(b Seq [MPa vs N
| N | Seq [MPa |
|---|---|
| 2.0e+03 | 780 |
| 5.0e+03 | 600 |
| 1.0e+04 | 480 |
| 2.0e+04 | 380 |
| 5.0e+04 | 280 |
| 1.0e+05 | 230 |
| 2.0e+05 | 180 |
| 5.0e+05 | 140 |
| 1.0e+06 | 120 |
| 2.0e+06 | 100 |
| 5.0e+06 | 80 |
| 1.0e+07 | 70 |
(c Smax [MPa vs N
Legend
- R = 0.500000 — color: green; symbol: diamond
- R = 0.600000 — color: blue; symbol: square
- R = 0.800000 — color: pink; symbol: square
- UTS = 800.000000 — color: grey; symbol: square
- YS = 600.000000 — color: orange; symbol: diamond
- Sexp = 830.000000 — color: black; symbol: circle
Annotations
- YS = 600.000000 (horizontal_line - position: y = 600)
- UTS = 800.000000 (horizontal_line - position: y = 800)
| N | Smax [MPa (R = 0.5) | Smax [MPa (R = 0.6) | Smax [MPa (R = 0.8) |
|---|---|---|---|
| 1.1e+04 | 800 | null | null |
| 1.8e+04 | 700 | 800 | null |
| 3.0e+04 | 580 | 680 | null |
| 1.0e+05 | 340 | 450 | 790 |
| 2.0e+05 | 270 | 360 | 660 |
| 5.0e+05 | 210 | 280 | 520 |
| 1.0e+06 | 170 | 230 | 430 |
| 2.0e+06 | 150 | 200 | 360 |
| 5.0e+06 | 130 | 170 | 290 |
| 1.0e+07 | 120 | 160 | 240 |
Notes: Fatigue Curvefit Constants: P: 0.752, A: 11.689, B: 2.893, C: 30.000, L: 30.000, UTS: 800, YS: 600, Sexp: 830.
(a) Model parameters; (b) Seq-N; (c) Smax-N (for R=0.5, 0.6, 0.8)
Figure 11-7 – ESALOAD S-N curves for A2-80 stainless steel bolts (UTS=800MPa)

Figure description:
The image contains the letters "E" and "CSS" in white on a blue and white parallelogram background. "E" is in italics on a white section, and "CSS" is on a blue section.
Material Group : titanium alloys [p] -> Material Alloy : 6Al-4V ---[1] -> Material Description : [d1] Ti-6Al-4V, d=3/16'' p:32/inch ABS 0114-12-P screw R=(0.6 ->
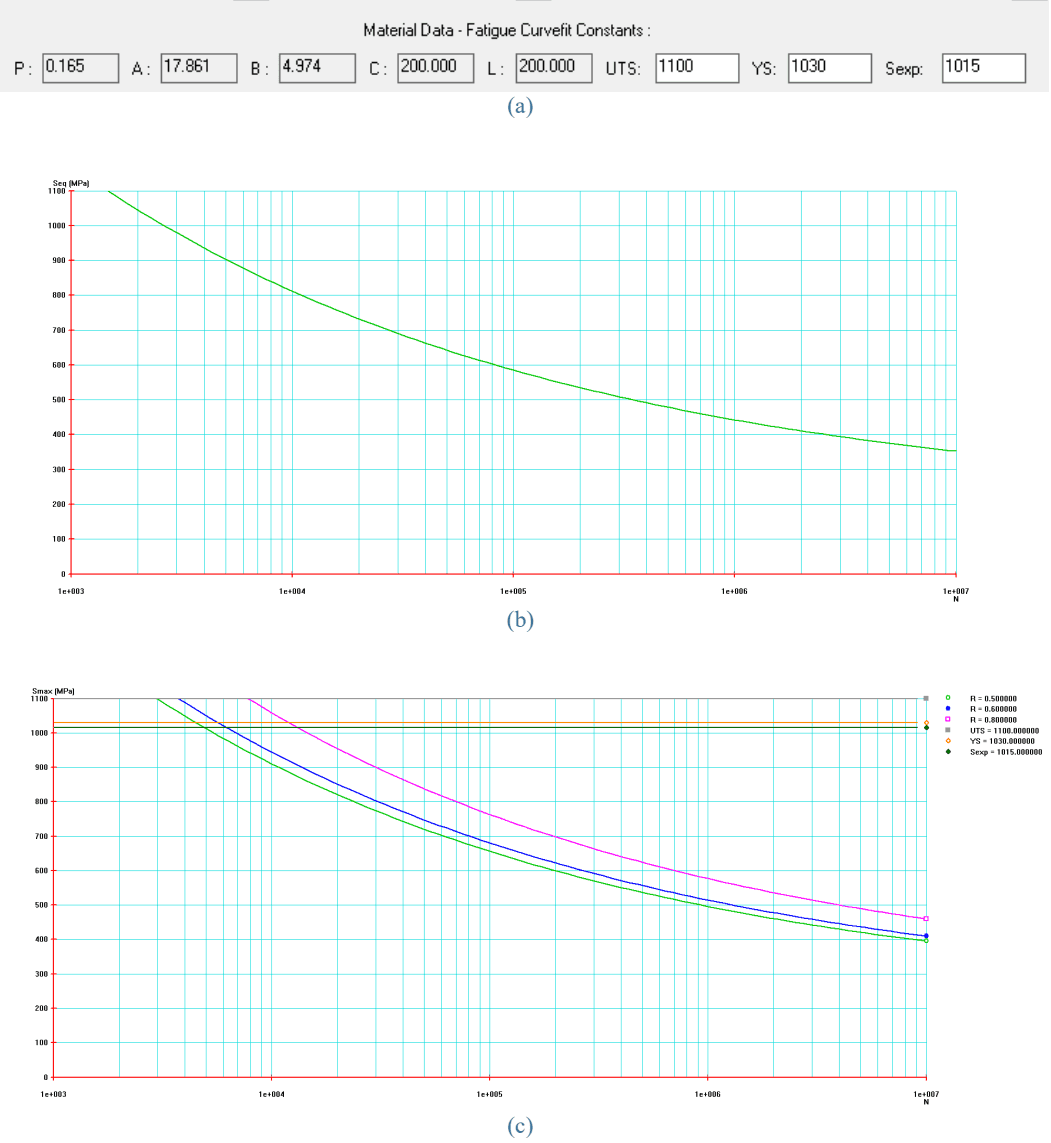
Figure description:
Material Data - Fatigue Curvefit Constants
(b Equivalent Stress Seq [MPa vs N
| N (cycles) | Seq [MPa |
|---|---|
| 1.00E+03 | 1100 |
| 2.00E+03 | 1030 |
| 5.00E+03 | 900 |
| 1.00E+04 | 810 |
| 2.00E+04 | 720 |
| 5.00E+04 | 620 |
| 1.00E+05 | 570 |
| 2.00E+05 | 510 |
| 5.00E+05 | 450 |
| 1.00E+06 | 420 |
| 2.00E+06 | 395 |
| 5.00E+06 | 370 |
| 1.00E+07 | 350 |
(c Maximum Stress Smax [MPa vs N
Legend
- R = 0.500000 — color: green; symbol: Line with square marker
- R = 0.600000 — color: blue; symbol: Line with circle marker
- R = 0.800000 — color: magenta; symbol: Line with diamond marker
- UTS = 1100.000000 — color: grey; symbol: Solid horizontal line
- YS = 1030.000000 — color: orange; symbol: Solid horizontal line
- Sexp = 1015.000000 — color: dark green; symbol: Solid horizontal line
Annotations
- UTS = 1100.000000 (horizontal_line - position: y = 1100)
- YS = 1030.000000 (horizontal_line - position: y = 1030)
- Sexp = 1015.000000 (horizontal_line - position: y = 1015)
| N (cycles) | Smax (R=0.5 [MPa) | Smax (R=0.6 [MPa) | Smax (R=0.8 [MPa) | UTS [MPa | YS [MPa | Sexp [MPa |
|---|---|---|---|---|---|---|
| 1.00E+03 | null | null | null | 1100 | 1030 | 1015 |
| 4.00E+03 | 1100 | null | null | 1100 | 1030 | 1015 |
| 5.00E+03 | 1050 | 1100 | null | 1100 | 1030 | 1015 |
| 8.00E+03 | 950 | 1000 | 1100 | 1100 | 1030 | 1015 |
| 1.00E+04 | 900 | 930 | 1050 | 1100 | 1030 | 1015 |
| 2.00E+04 | 800 | 830 | 960 | 1100 | 1030 | 1015 |
| 5.00E+04 | 690 | 720 | 850 | 1100 | 1030 | 1015 |
| 1.00E+05 | 630 | 660 | 770 | 1100 | 1030 | 1015 |
| 2.00E+05 | 570 | 600 | 700 | 1100 | 1030 | 1015 |
| 5.00E+05 | 510 | 530 | 620 | 1100 | 1030 | 1015 |
| 1.00E+06 | 470 | 490 | 580 | 1100 | 1030 | 1015 |
| 2.00E+06 | 440 | 460 | 540 | 1100 | 1030 | 1015 |
| 5.00E+06 | 410 | 430 | 490 | 1100 | 1030 | 1015 |
| 1.00E+07 | 390 | 410 | 460 | 1100 | 1030 | 1015 |
Notes: (a Fatigue Curvefit Constants: P = 0.165, A = 17.861, B = 4.974, C = 200.000, L = 200.000, UTS = 1100, YS = 1030, Sexp = 1015.)
(a) Model parameters; (b) Seq-N; (c) Smax-N (for R=0.5, 0.6, 0.8)
Figure 11-8 – ESALOAD S-N curves for Ti6Al4V bolts (UTS=1100MPa)
Note that the data provided in ESAFATIG is determined for aerospace grade fasteners. A small study has shown that industrial grade fasteners can perform significantly worse (reference 11.7). The figure below, from reference 11.7, compares the same type of stainless steel screws (DIN 912) procured to aerospace (DIN65058. ‘JM’) and industrial standard (Wurth and Fabory).

Figure description:
Maximum Stress vs Cycles to Failure
Legend
- WURTH-0.6 — color: blue; symbol: Dot and Solid line
- FABORY-0.6 — color: red; symbol: Square and Solid line
- JM1-0.6 — color: yellow; symbol: Triangle and Orange Solid line
- JM1-0.8 — color: cyan; symbol: Dot and Cyan Solid line
- JM2-0-8 — color: purple; symbol: Dot and Purple Solid line
- A2_80-0.6 — color: dark green; symbol: Dashed line
- A2_80-0.8 — color: light green; symbol: Dashed line
- JM2-0.6 — color: orange; symbol: Triangle and Brown Solid line
| Cycles to Failure | WURTH-0.6 (MPa) | FABORY-0.6 (MPa) | JM1-0.6 (MPa) | JM1-0.8 (MPa) | JM2-0-8 (MPa) | JM2-0.6 (MPa) | A2_80-0.6 (MPa) | A2_80-0.8 (MPa) |
|---|---|---|---|---|---|---|---|---|
| 12000 | 700 | |||||||
| 15000 | 700 | |||||||
| 22000 | 615 | 700 | ||||||
| 24000 | 655 | |||||||
| 25000 | 615 | 800 | ||||||
| 27000 | 705 | |||||||
| 28000 | 530 | |||||||
| 32000 | 700 | 710 | ||||||
| 33000 | 700 | |||||||
| 35000 | 615 | |||||||
| 40000 | 690 | 700 | ||||||
| 42000 | 700 | |||||||
| 45000 | 615 | |||||||
| 50000 | 700 | |||||||
| 55000 | 440 | 570 | ||||||
| 60000 | 665 | 655 | ||||||
| 62000 | 530 | |||||||
| 65000 | 530 | |||||||
| 70000 | 720 | 640 | 800 | |||||
| 72000 | 665 | |||||||
| 80000 | 440 | 530 | 650 | 720 | 635 | |||
| 82000 | 625 | |||||||
| 85000 | 350 | 615 | ||||||
| 90000 | 720 | |||||||
| 95000 | 615 | |||||||
| 100000 | 630 | 720 | 450 | |||||
| 110000 | 530 | 600 | 720 | 640 | ||||
| 120000 | 440 | 720 | 615 | |||||
| 130000 | 615 | 700 | 640 | |||||
| 140000 | 600 | |||||||
| 150000 | 440 | 700 | 630 | 600 | ||||
| 170000 | 690 | 590 | ||||||
| 180000 | 260 | 395 | ||||||
| 230000 | 260 | 395 | ||||||
| 240000 | 600 | |||||||
| 250000 | 600 | |||||||
| 270000 | 260 | |||||||
| 280000 | 690 | 600 | ||||||
| 300000 | 690 | |||||||
| 340000 | 355 | |||||||
| 350000 | 350 | 600 | 680 | 690 | 600 | |||
| 400000 | 600 | 400 | 300 | |||||
| 420000 | 680 | |||||||
| 450000 | 350 | 690 | ||||||
| 550000 | 350 | 595 | 690 | |||||
| 750000 | 295 | 700 | ||||||
| 800000 | 595 | |||||||
| 1000000 | 265 | 580 | 300 | 230 | ||||
| 1200000 | 305 | |||||||
| 1400000 | 265 | |||||||
| 1800000 | 265 | |||||||
| 3800000 | 175 | 570 | ||||||
| 4000000 | 250 | |||||||
| 4200000 | 595 | |||||||
| 5000000 | 170 | |||||||
| 5400000 | 175 | |||||||
| 5800000 | 575 | |||||||
| 6200000 | 595 | |||||||
| 10000000 | 600 | 685 | 665 | 570 | 250 | 150 | ||
| 10000000 | 665 | 525 | ||||||
| 10000000 | 645 | |||||||
| 10000000 | 625 |
Notes: The chart is a semi-log plot showing Maximum Stress (MPa versus Cycles to Failure. There are various series of fatigue tests represented by points, with corresponding fitted trend lines. Two additional dashed lines (A2_80-0.6 and A2_80-0.8 represent reference or boundary curves.))
Industrial grade (Wurth & Fabory) tested at R=0.6, aerospace grade (JM, 2 batches) tested at R=0.6 and 0.8. ESAFATIG data for A2-80 screws is provided for reference
Figure 11-9 – Fatigue test results for M5 DIN 912 stainless steel screws, A2-70
| BATCH | SPECIMEN | STRESS (MPa) | AVERAGE STRESS (MPa) | ||
|---|---|---|---|---|---|
| YIELD | RUPTURE | YIELD | RUPTURE | ||
| JM1 | 1 | 579 | 747 | 584 | 746 |
| 2 | 594 | 754 | |||
| 3 | 580 | 736 | |||
| JM2 | 1 | 612 | 759 | 612 | 754 |
| 2 | 618 | 757 | |||
| 3 | 606 | 747 | |||
| WURTH | 1 | 723 | 843 | 720 | 842 |
| 2 | 720 | 835 | |||
| 3 | 716 | 847 | |||
| FABORY | 1 | 748 | 891 | 731 | 884 |
| 2 | 715 | 885 | |||
| 3 | 714 | 861 | |||
| 4 | 748 | 900 | |||
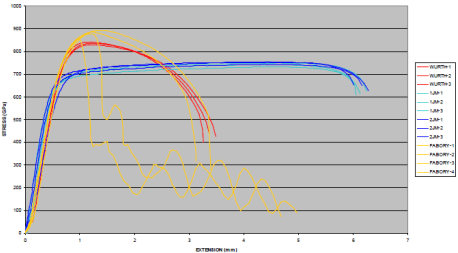
Figure description:
Stress-Extension Curves
STRESS (GPa vs EXTENSION (mm
Legend
- WURTH-1 — color: red; symbol: Solid line
- WURTH-2 — color: red; symbol: Solid line
- WURTH-3 — color: red; symbol: Solid line
- 1JM-1 — color: cyan; symbol: Solid line
- 1JM-2 — color: cyan; symbol: Solid line
- 1JM-3 — color: cyan; symbol: Solid line
- 2JM-1 — color: dark blue; symbol: Solid line
- 2JM-2 — color: dark blue; symbol: Solid line
- 2JM-3 — color: dark blue; symbol: Solid line
- FABORY-1 — color: yellow; symbol: Solid line
- FABORY-2 — color: yellow; symbol: Solid line
- FABORY-3 — color: yellow; symbol: Solid line
- FABORY-4 — color: yellow; symbol: Solid line
| EXTENSION (mm) | WURTH-1 | WURTH-2 | WURTH-3 | 1JM-1 | 1JM-2 | 1JM-3 | 2JM-1 | 2JM-2 | 2JM-3 | FABORY-1 | FABORY-2 | FABORY-3 | FABORY-4 |
|---|---|---|---|---|---|---|---|---|---|---|---|---|---|
| 0 | 0 | 0 | 0 | 0 | 0 | 0 | 0 | 0 | 0 | 0 | 0 | 0 | 0 |
| 0.5 | 420 | 440 | 460 | 500 | 480 | 490 | 550 | 530 | 540 | 410 | 430 | 450 | 470 |
| 1.0 | 810 | 820 | 830 | 700 | 690 | 705 | 710 | 705 | 715 | 830 | 840 | 850 | 860 |
| 1.5 | 835 | 840 | 845 | 710 | 700 | 715 | 725 | 720 | 735 | 400 | 880 | 875 | 890 |
| 2.0 | 810 | 805 | 815 | 720 | 710 | 725 | 735 | 730 | 745 | 300 | 830 | 825 | 840 |
| 2.5 | 740 | 735 | 745 | 730 | 720 | 735 | 740 | 735 | 750 | 250 | 750 | 745 | 760 |
| 3.0 | 620 | 610 | 630 | 740 | 730 | 745 | 745 | 740 | 755 | 350 | 500 | 480 | 520 |
| 3.5 | 460 | 440 | 480 | 745 | 735 | 750 | 748 | 745 | 758 | 200 | null | null | null |
| 4.0 | null | null | null | 745 | 735 | 750 | 750 | 745 | 758 | 250 | null | null | null |
| 4.5 | null | null | null | 740 | 730 | 745 | 748 | 743 | 755 | 150 | null | null | null |
| 5.0 | null | null | null | 730 | 720 | 735 | 742 | 738 | 750 | 80 | null | null | null |
| 5.5 | null | null | null | 710 | 700 | 715 | 725 | 720 | 735 | null | null | null | null |
| 6.0 | null | null | null | 620 | 610 | 630 | 670 | 650 | 700 | null | null | null | null |
| 6.3 | null | null | null | null | null | null | 630 | 630 | 630 | null | null | null | null |
Notes: The chart shows tensile test results for various specimens (WURTH, 1JM, 2JM, and FABORY series. The FABORY series exhibits significant inconsistency, particularly FABORY-1 which shows a sharp drop in stress followed by oscillations. The 1JM and 2JM series show higher ductility with failure occurring after 6 mm extension, whereas WURTH and most FABORY specimens fail around 3.5 mm.)
Industrial grade (Wurth (red) & Fabory (yellow)) screws show higher strength and lower ductility than aerospace grade (JM, 2 batches (blue)) screws
Figure 11-10 – Tensile test results for M5 DIN 912 stainless steel screws, A2-70
Figure description:
Key Information:
- Text: ECSS
- Visual Elements: A slanted rectangular frame (parallelogram divided into two sections.
- Colors: Purple and white.
- Layout: The letter "E" is white on a white background (outlined/italicized style, and the letters "CSS" are white on a solid purple background.
- Entity: ECSS (European Cooperation for Space Standardization.
Some observations (reference 11.7):
- • Fatigue properties for ‘aerospace grade’ fasteners tested were very good. Very little dispersion within and between the 2 batches tested was observed.
- • Fatigue properties of ‘industrial grade’ fasteners were significantly below those of aerospace grade. Possible causes:
- Fastener quality was in fact closer to class A2-80 (more cold worked);
- Potentially lower quality of commercial fasteners, e.g. lower surface hardness and lower surface quality.
- • Based on these test results it can be prudent to use fatigue properties of the stronger A2-80 material to verify fatigue life of A2-70 fasteners, or alternatively to make sure that properties are really below those of A2-80 when using the properties of this study. Fastener strength classes are defined by minimum strength properties. There upon, no separate A2-70 material properties were included in ESAFATIG at the time.
It is important that truly fatigue critical fasteners are procured to a standard that ‘fatigue rates’ the fasteners by a batch fatigue test. Be aware that some of the smaller or shorter sizes are not be actually batch tested per such standards and will need to be fatigue tested in custom set-ups. Example: NASA- STD-5019A requires ‘low risk’ (i.e. ‘high quality’) fasteners, which operate at stress levels >0,3xUTS (incl. preload), to be batch fatigue tested. This is a category not included in the current ECSS-E-ST-32-01.
11.2.2 Palmgren – Miner rule
All cyclic stresses above the fatigue threshold level give rise to permanent fatigue damage. Damage accumulates whether there is continuous load variation or whether there are single cycles separated by long periods of time. Equal damage can arise from a small number of high stress cycles or a large number of low stress cycles. This is best envisaged using the S-N curve Figure 11-1.
It is normally assumed that when the sum total of the fractional damage at all stress levels reaches unity, failure can occur.
The mathematical expression of the above concept is known as the Palmgren - Miner Linear cumulative damage rule. A scatter factor of 4 is typically applied to fatigue damage to allow for uncertainty in the fatigue analysis (see Reference 12.4). Thus, for fatigue resistant design, it is necessary to satisfy the following inequality,
where f is the total fatigue damage and Ω is the fatigue damage.
The fatigue damage is given by,
where ni is the number of cycles that have occurred at a particular mean and alternating stress, Nf,i is the number of cycles to failure at the same stress condition, and m is the number of stress conditions that the joint is subjected to.
11.2.3 Fatigue Design Principles
11.2.3.1 Overview
Any factors that affect stress can affect fatigue life. Such factors give rise to the basic design principles as listed in the following sections.
11.2.3.2 Static and Dynamic Loading
Appropriate joint design can greatly reduce the external loads felt by the fasteners and increase the life of the joint. Any features of the design that increase the fastener compliance or decrease clamped part's compliance can have a similar effect, e.g. smaller diameter, longer, or reduced shank bolts. For more information on fastener compliance, refer to Section 7.5. The choice of fastener material can also have a significant impact. The joint diagram in Figure 11-11 illustrates that a titanium fastener with half the elastic modulus of a steel fastener feels only half of the external load (). Figure 11-12 compares the fatigue performance of M8 fasteners made from the two materials operating at a mean stress of .

Figure description:
Effect of Bolt Material on Joint Loading
Axial Load vs Axial Deflection for Steel and Titanium Bolted Joints
Legend
- Steel curve — color: black; symbol: steeper solid line
- Titanium curve — color: black; symbol: shallower solid line
- Titanium Peak Level — color: black; symbol: dashed horizontal line
Annotations
- F_V (text_label - position: y = 7.0)
- F_A (STEEL (vertical_span - position: y = 4.0 to y = 10.0))
- F_A (TITANIUM (vertical_span - position: y = 2.5 to y = 8.5))
- 2 ΔF_{b,A} (STEEL (vertical_span - position: y = 7.0 to y = 10.0))
- 2 ΔF_{b,A} (TITANIUM (vertical_span - position: y = 7.0 to y = 8.5))
- AXIAL LOAD (axis_label - position: y-axis)
- AXIAL DEFLECTION (axis_label - position: x-axis)
| Point Description | Material | Axial Deflection (rel.) | Axial Load (rel.) |\n| :--- | :--- | :---: | :---: |\n| Bolt Line Origin | Both | 0.0 | 0.0 |\n| Bolt Line @ Preload (Fv) | Steel | 3.5 | 7.0 |\n| Bolt Line @ Preload (Fv) | Titanium | 7.0 | 7.0 |\n| Peak Bolt Load (Fv + Delta Fb) | Steel | 5.0 | 10.0 |\n| Peak Bolt Load (Fv + Delta Fb) | Titanium | 9.0 | 8.5 |\n| Member Line Start (at Peak) | Steel | 5.0 | 10.0 |\n| Member Line Start (at Peak) | Titanium | 9.0 | 8.5 |\n| Member Line End (at zero load) | Steel | 7.0 | 0.0 |\n| Member Line End (at zero load) | Titanium | 11.5 | 0.0 |\n| Bottom of Fa span | Steel | 5.0 | 4.0 |\n| Bottom of Fa span | Titanium | 9.0 | 2.5 |
Notes: The diagram illustrates a bolted joint comparison (Rötscher's diagram where a less stiff bolt material like titanium reduces the additional bolt load (2 ΔF_{b,A} compared to steel for the same applied external axial load (F_A. The dashed line represents the maximum load level for the titanium bolt assembly.)))
Figure 11-11 - Joint Diagram Comparing Steel and Titanium Fasteners
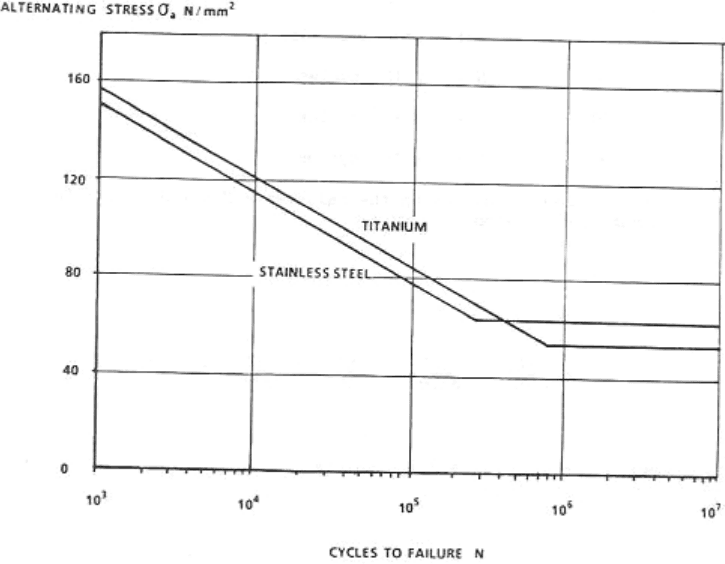
Figure description:
S-N Curves for Titanium and Stainless Steel Comparison of fatigue properties between Titanium and Stainless Steel
ALTERNATING STRESS σ_a N/mm² vs. CYCLES TO FAILURE N
Legend
- TITANIUM — color: black; symbol: solid line
- STAINLESS STEEL — color: black; symbol: solid line
| Cycles to Failure (N) | Titanium (N/mm²) | Stainless Steel (N/mm²) |
|---|---|---|
| 1000 | 158 | 152 |
| 10000 | 120 | 114 |
| 100000 | 83 | 77 |
| 300000 | 64 | 58 |
| 1000000 | 61 | 51 |
| 10000000 | 61 | 51 |
Notes: The chart displays S-N curves for Titanium and Stainless Steel. The x-axis (Cycles to Failure N uses a logarithmic scale from 10^3 to 10^7, while the y-axis (Alternating Stress is linear. Both materials exhibit an endurance limit where the stress levels off horizontally.))
Figure 11-12 - Typical Fatigue Comparison, Ref. 11.8
11.2.3.3 Fastener Geometry and Manufacturing
It is important to specify fasteners that are designed to reduce the stress concentrations , and to incorporate all features such as large under head radius, large thread root radius and close tolerance threads.
It is also important to specify rolled threads, and in particular, thread rolling and cold working of the under head radius is carried out as the final manufacturing operation to guarantee beneficial compressive stresses.
11.2.3.4 Assembly Methods
Preload is the most important joint parameter in resisting external loads (see Section 6). It is important to use the most accurate preloading method (appropriate to the assembly) together with a dry lubrication system that gives the most consistent (rather than the lowest) friction conditions.
It is important to measure prevailing torque during each assembly operation and that torque is added to the torque specified for preloading.
11.2.3.5 Surface Finish Defects and Other Damage
It is important to pay special attention to surface finish and Non Destructive Inspection (NDI) procedures for safe life PFCI fasteners. Fatigue life can be greatly reduced by flaws, scratches or abrasions arising either during manufacturing or while in service.
Other effects that are important to be considered are differential thermal stresses, stress corrosion and fretting under load.
Figure description:
Entity: ECSS Text: E CSS