11.3.1 Fracture Control
Fracture control is multi-disciplinary and includes the engineering disciplines of fracture mechanics for the assessment of damage tolerance (safe operating life), non-destructive inspection to screen for damage, quality and process controls, material lot traceability and proof testing to assure the highest quality part. The combination of these disciplines into a viable fracture control plan ensures that parts whose failure can lead to loss of life or vehicle provide adequate safety [ref 11.10].
The basic assumptions that underlie implementation of fracture control include:
- • All structural elements can contain crack‐like defects located in the most critical area of the component in the most unfavourable orientation.
- • The fact that the applied non‐destructive inspection (NDI) do not detect (significant) defects does not negate this assumption, but merely establishes a lower bound on the initial size of the cracks to be used for verification.
- • All critical spaceflight hardware is of a good design, certified for the application, adequately acceptance tested, and manufactured and assembled using high quality aerospace processes. It is important that it contains no detected defects, unless specifically justified and approved.
The implementation of fracture control utilizes part classifications to identify their criticality (Ref. 11.1) potential fracture critical (PFCI) and fracture critical (FCI).
Non-fracture critical PFCI include safe life parts (with standard initial crack size), low released or contained masses, redundant (fail safe) structure, non-hazardous leak-before-burst (LBB) pressurized components, low speed and low momentum rotating machinery, and high quality (low risk) parts with high margins on cycle life and strength (i.e. with low risk of failure caused by a crack-like defect).
Note that historically the term ‘safe life’ is used for spaceflight hardware where a safe crack growth life is demonstrated. This is still the case in ECSS standards. This differs from usage of this term in e.g. aeronautics. In more recent standards (e.g. NASA-STD-5019) NASA has changed towards the term ‘damage tolerant’.
Sometimes fracture control and fracture mechanics verification are understood to be the same thing. However, by applying non-fracture critical categories like fail-safe, low risk and containment, it can be possible to implement fracture control without fracture mechanics analyses or tests.
Sometimes fracture mechanics assessments are used outside the formal framework of the fracture control standards, e.g. to conservatively assess fatigue life (durability). The initial crack size can then be based on other experiences and information than the applied crack detection methods, for example a = c = 0,125 mm (corner or surface crack) per ECSS-E-ST-32-01.
Normally, safety critical fasteners are procured in accordance with aerospace practices, following standards like references 11.12, 11.13 or equivalent. In addition, a method for assurance of fastener integrity is required.
According to ECSS-E-ST-32-01 all PFCI fasteners are procured and tested in conformance with aerospace standards for structural fasteners or equivalent specifications agreed with the customer. For example, LN, AIR and NAS standards, or ISO, EN and national standards which are explicitly intended for aerospace applications. ‘Fasteners procured and tested in conformance with aerospace standards for non- structural fasteners shall not be used’ (example Ref. 11.21). However, for secondary connections where
significant redundancy exists and fatigue is not a major concern, sometimes such non-structural fasteners are applied.
Preferably, fasteners be designed and verified to be fail safe.
According to ECSS-E-ST-32-01 threaded fasteners can only be considered ‘low risk’ when the stress (incl. preload) does not exceed 0,3 x UTS during the life, which limits this category generally to threaded fasteners used as shear pins with low preload.
Safe life fasteners have to be sufficiently large in diameter (minimum 5mm but preferably larger) and of the highest aerospace quality manufactured from A286 steel, Inconel 718, MP35 N alloy or similarly tough and environmentally compatible alloys.
It is important that fracture critical (or low risk) bolts in tension applications are not been fabricated from low fracture toughness alloys or specifically titanium (unless agreed otherwise, see below).
The eddy current method is the preferred method for inspection of fracture critical threaded fasteners. General guidance can be found in the ECSS-Q-ST-70-15C (Ref. 11.14) on NDT, more specific information can be found in e.g. NASA-JSC PRC 6509 (Ref. 11.15). The associated standard surface crack size for eddy current is: depth a=1,27mm, length 2c=2,54mm. Dye penetrant inspection is generally considered insufficient, because rolled threads, and other rolled radii cannot be etched as normally required before penetrant inspection for fracture control, in order to avoid degradation of the fastener quality. Penetrant inspection is sometimes performed without etching, but more as a general quality check instead of basis for safe life analysis.
In case preloaded fasteners without threads rolled after all thermal treatment of the material be used, in agreement with the customer, in addition to the crack size associated with the NDI, also a so-called ‘maximum machining defect’ (of depth 0,127mm all along the thread) that is generally smaller than the reliably detectable crack size, if often considered as additional risk mitigation (Ref. 11.9).
Performing a proof test for crack screening of fasteners is generally not easy. See also ECSS-E-ST-32-01. Sometimes this is agreed between customer and supplier, but most of the time it is some sort of compromise for risk mitigation as part of implementation of the ‘reduced fracture control programme’ for non-human spaceflight, and often supported by NDI after proof testing (some sort of ‘proof test enhanced NDI’). This works best if only small crack growth is predicted, and no significant SCC, EAC or SLC (as can be the case for titanium fasteners) has to be accounted for.
Titanium fasteners
Over the years, a lot of debate has occurred about the risks associated with the application of titanium preloaded fasteners. The latest NASA fracture control standard [ref 11.16] prohibits titanium for low risk fasteners, while for fracture critical and safe life fasteners titanium is discouraged (esp. for fracture critical ones) and subject to approval of the responsible fracture control authority. The ECSS standard [Ref 11.1] prohibits titanium safe life fasteners generally, but defines no specific limitation for fail-safe titanium fasteners.
The concerns highlighted in NASA-STD-5019A are: generic environmentally assisted or sustained load cracking failure modes, as well as low fracture toughness. For safe life (damage tolerant) titanium fasteners: Titanium alloys, such as Ti-6Al-4V (including annealed and STA conditions), cp-Ti, and other titanium alloys, have potential generic EAC or SLC failure modes that are to be addressed in the assessment with test data from flawed fasteners in the applicable service life environments (incl. air).
Additional background information on sustained load cracking of titanium can be found in Ref. [11.17].
In addition, NASA-STD-5019A explains: Growth of a pre-existing crack in susceptible metallic alloys under sustained stress without assistance from an external environment. SLC, because of the presence
of interstitial hydrogen, occurs in titanium alloys, including commercially pure titanium (cp-Ti) and Ti- 6Al-4V (Ti64), in both annealed and solution treated and aged (STA) conditions. Testing is necessary to determine the threshold stress intensity for the titanium alloy metallurgical condition and interstitial hydrogen content. Other materials with different crystalline structures such as steel and aluminum alloys that do not allow interstitial hydrogen can still exhibit SLC behaviours. A threshold stress intensity factor can be obtained by procedures such as those in ASTM E1681 for the case of an inert or vacuum environment. One publication determines the effects of hydrogen content and temperature on SLC in Ti-6Al-4V (Boyer and Spurr, 1978, Ref. [11.18]).
An update of the ECSS fracture control standard was released in 2021 (Rev. 2 of Ref. [11.1]). For uncrewed application titanium safe life fasteners are now permitted, based on a sustained load cracking threshold of 50% of the fracture toughness. This 50% value is considered a reasonable lower bound of the values observed in literature (Ref. [11.17] and specifically [11.19] and [11.20]).
For more critical applications (esp. human spaceflight), additional test data can be required for verification.
As part of the so-called ‘reduced fracture control programme’ (applicable to non-human spaceflight) a new risk-based approach for safe life fasteners is included, based on the fact that a crack of the order of 0,63mm (a value of 0,025” used also in some NASA standards) can be considered as unlikely to exist in a high-quality part, independent of the applied NDI. Note that for critical applications a larger initial crack size can apply. In Figure 11-13 to Figure 11-18 some residual bolt strength curves are presented for some commonly applied fastener materials, which provide rough indications of the maximum sustained stress level allowed in the fasteners in the limiting case that no significant fatigue crack growth occurs. The curves are defined using the NASGRO (v.9) model SC08 (see also Figure 11-20) with crack size a=c=0,63mm. The red lower bound curves is defined by the minimum strength defined by toughness (K1e or 50% of K1e for titanium; blue curves) and flow stress (average of yield and ultimate strength; orange curves). In most cases, the flow stress criterion is driving, except for Ti6Al4V STA (Figure 11-13). The toughness curve tends to be slightly decreasing for increasing bolt size, because the larger root radius causes an increased depth affected by high stresses (size effect of stress concentration). The curve based on the flow stress criterion tends to be slightly increasing, due to the relative decrease of the crack size w.r.t. the cross-sectional area. For reference, lines at applied sustained stress levels 70% (yellow), 80% (blue) and 90% (green) of the yield strength (for uncracked geometry) are also provided.
Internal thread in safe life items can be of particular concern, because it will be difficult to inspect and cracks could emanate from sharp notches, and only few suitable standard cracked geometries exist in crack-growth software like NASGRO. It is recommendable to avoid this wherever possible. Such threads will not only be directly loaded by the bolt, but can also be loaded by other loads applied to the item, and the resulting stress distribution can be complex. This can be the most critical location of the part, even if the corresponding bolt pattern is verified as fail safe. The acceptance rationale can also benefit from the risk-based approach, using 0.63mm initial crack size, mentioned above (see ref. 11.1, rev.2, clause 11.2.2.6), at least for non-human spaceflight. In some cases also the a so-called ‘maximum machining defect’ (of depth 0,127mm all along the thread), mentioned above for external thread, can be considered as additional risk assessment.
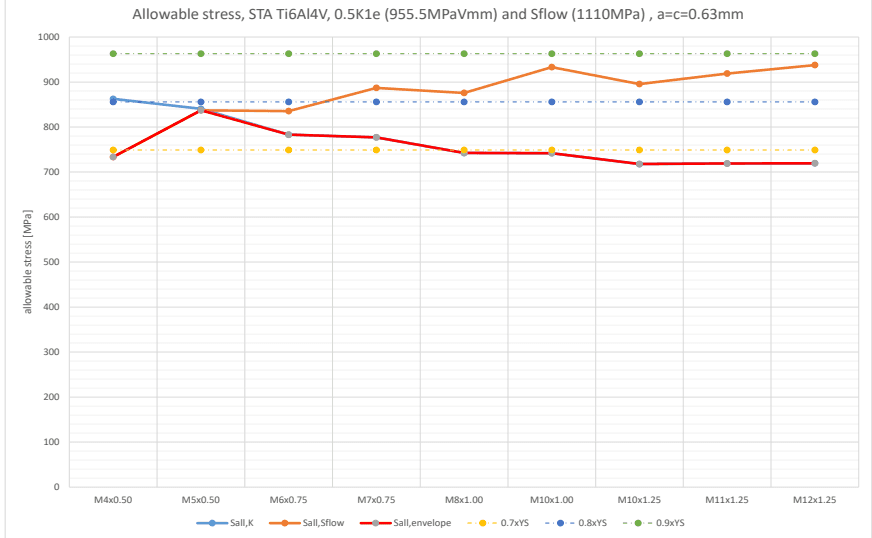
Figure description:
Allowable stress for STA Ti6Al4V bolts
Allowable stress, STA Ti6Al4V, 0.5K1e (955.5MPa√mm and Sflow (1110MPa , a=c=0.63mm
Legend
- Sall,K — color: blue; symbol: Solid line with circle markers
- Sall,Sflow — color: orange; symbol: Solid line with circle markers
- Sall,envelope — color: red; symbol: Solid line with grey circle markers
- 0.7xYS — color: yellow; symbol: Dashed line with circle markers
- 0.8xYS — color: dark blue; symbol: Dash-dotted line with circle markers
- 0.9xYS — color: green; symbol: Dash-dotted line with circle markers
| Bolt Size | Sall,K | Sall,Sflow | Sall,envelope | 0.7xYS | 0.8xYS | 0.9xYS |
|---|---|---|---|---|---|---|
| M4x0.50 | 862 | 734 | 734 | 749 | 856 | 963 |
| M5x0.50 | 841 | 837 | 837 | 749 | 856 | 963 |
| M6x0.75 | 784 | 836 | 784 | 749 | 856 | 963 |
| M7x0.75 | 778 | 887 | 778 | 749 | 856 | 963 |
| M8x1.00 | 743 | 876 | 743 | 749 | 856 | 963 |
| M10x1.00 | 742 | 934 | 742 | 749 | 856 | 963 |
| M10x1.25 | 718 | 896 | 718 | 749 | 856 | 963 |
| M11x1.25 | 719 | 919 | 719 | 749 | 856 | 963 |
| M12x1.25 | 720 | 938 | 720 | 749 | 856 | 963 |
Notes: The Y-axis represents allowable stress in MPa, and the X-axis represents various bolt sizes. Sall,envelope is the lower bound of the Sall,K and Sall,Sflow series. Reference lines for 0.7xYS, 0.8xYS, and 0.9xYS are included based on constant values across bolt sizes.
YS=1070MPa; K1e =1910MPa√mm; sustained stress limited by 0.5x K1e
Figure 11-13 – Residual bolt strength under sustained loads, Ti6Al4V STA

Figure description:
Allowable stress, annealed Ti6Al4V, 0.5K1e (1129.5MPaVmm and Sflow (978.5MPa , a=c=0.63mm
Allowable stress, annealed Ti6Al4V, 0.5K1e (1129.5MPaVmm and Sflow (978.5MPa , a=c=0.63mm
Legend
- Sall,K — color: light blue; symbol: Solid line with circles
- Sall,Sflow — color: orange; symbol: Solid line with circles
- Sall,envelope — color: red; symbol: Thick solid line with grey circles
- 0.7xYS — color: yellow; symbol: Dashed line with circles
- 0.8xYS — color: dark blue; symbol: Dashed line with circles
- 0.9xYS — color: green; symbol: Dashed line with circles
| Thread size | Sall,K [MPa | Sall,Sflow [MPa | Sall,envelope [MPa | 0.7xYS [MPa | 0.8xYS [MPa | 0.9xYS [MPa |
|---|---|---|---|---|---|---|
| M4x0.50 | null | 647.2 | 647.2 | 666.1 | 761.2 | 856.4 |
| M5x0.50 | null | 737.5 | 737.5 | 666.1 | 761.2 | 856.4 |
| M6x0.75 | null | 736.1 | 736.1 | 666.1 | 761.2 | 856.4 |
| M7x0.75 | null | 781.9 | 781.9 | 666.1 | 761.2 | 856.4 |
| M8x1.00 | 878.3 | 771.2 | 771.2 | 666.1 | 761.2 | 856.4 |
| M10x1.00 | 878.3 | 821.4 | 821.4 | 666.1 | 761.2 | 856.4 |
| M10x1.25 | 848.4 | 788.2 | 788.2 | 666.1 | 761.2 | 856.4 |
| M11x1.25 | 850.0 | 809.8 | 809.8 | 666.1 | 761.2 | 856.4 |
| M12x1.25 | 850.0 | 826.4 | 826.4 | 666.1 | 761.2 | 856.4 |
Notes: The chart shows allowable stress levels for different thread sizes of annealed Ti6Al4V. Sall,envelope matches Sall,Sflow throughout the plotted range. Sall,K values for threads smaller than M8x1.00 are above the chart's vertical limit (900 MPa.)
YS=950MPa; K1e =2260MPa√mm; sustained stress limited by 0.5x K1e
Figure 11-14 – Residual bolt strength under sustained loads, Ti6Al4V annealed

Figure description:
Allowable stress, A286, K1e (4865MPa∘mm and Sflow (962.5MPa , a=c=0.63mm
Allowable stress, A286, K1e (4865MPa∘mm and Sflow (962.5MPa , a=c=0.63mm
Legend
- Sall,K — color: Light blue; symbol: Line with circle
- Sall,Sflow — color: Orange; symbol: Line with circle
- Sall,envelope — color: Red; symbol: Solid line with circle
- 0.7xYS — color: Yellow; symbol: Dashed line with circle
- 0.8xYS — color: Blue; symbol: Dashed line with circle
- 0.9xYS — color: Green; symbol: Dashed line with circle
| Thread Size | Sall,envelope [MPa | 0.7xYS [MPa | 0.8xYS [MPa | 0.9xYS [MPa |
|---|---|---|---|---|
| M4x0.50 | 637 | 577.5 | 660 | 742.5 |
| M5x0.50 | 726 | 577.5 | 660 | 742.5 |
| M6x0.75 | 724 | 577.5 | 660 | 742.5 |
| M7x0.75 | 769 | 577.5 | 660 | 742.5 |
| M8x1.00 | 759 | 577.5 | 660 | 742.5 |
| M10x1.00 | 809 | 577.5 | 660 | 742.5 |
| M10x1.25 | 776 | 577.5 | 660 | 742.5 |
| M11x1.25 | 797 | 577.5 | 660 | 742.5 |
| M12x1.25 | 813 | 577.5 | 660 | 742.5 |
Notes: The data values for Sall,envelope are estimated from the chart grid. The constant threshold lines for 0.7xYS, 0.8xYS, and 0.9xYS align with a yield strength (YS of 825 MPa. Note that Sall,K and Sall,Sflow are listed in the legend but appear to be subsumed by the Sall,envelope series in the visual plot.)
YS=825MPa; K1e=4865MPa√mm
Figure 11-15 – Residual bolt strength under sustained loads, A286 steel

Figure description:
Allowable stress, Inconel 718, K1e (2432MPa√mm and Sflow (1482.5MPa , a=c=0.63mm
Allowable stress, Inconel 718, K1e (2432MPa√mm and Sflow (1482.5MPa , a=c=0.63mm
Legend
- Sall,K — color: light blue; symbol: line with circle markers
- Sall,Sflow — color: orange; symbol: line with circle markers
- Sall,envelope — color: red; symbol: thick solid line
- 0.7xYS — color: yellow; symbol: dashed line with circle markers
- 0.8xYS — color: dark blue; symbol: dash-dotted line with circle markers
- 0.9xYS — color: green; symbol: dash-dotted line with circle markers
| Size | Sall,K | Sall,Sflow | Sall,envelope | 0.7xYS | 0.8xYS | 0.9xYS |
|---|---|---|---|---|---|---|
| M4x0.50 | 980 | 988 | 980 | 989 | 1131 | 1272 |
| M5x0.50 | 1131 | 1117 | 1117 | 989 | 1131 | 1272 |
| M6x0.75 | 1131 | 1114 | 1114 | 989 | 1131 | 1272 |
| M7x0.75 | 1184 | null | 1184 | 989 | 1131 | 1272 |
| M8x1.00 | 1170 | null | 1170 | 989 | 1131 | 1272 |
| M10x1.00 | 1245 | null | 1245 | 989 | 1131 | 1272 |
| M10x1.25 | 1195 | null | 1195 | 989 | 1131 | 1272 |
| M11x1.25 | 1227 | null | 1227 | 989 | 1131 | 1272 |
| M12x1.25 | 1252 | null | 1252 | 989 | 1131 | 1272 |
YS=1415MPa; K1e=2430MPa√mm
Figure 11-16 – Residual bolt strength under sustained loads, Inconel 718

Figure description:
Figure 11-17
- Title: Residual bolt strength under sustained loads, AISI 316 stainless steel
- Material Properties: YS = 690 MPa; = 4345 MPa
- X-axis: Crack depth 'a' [mm, range 0 to 6
- Y-axis: Residual Strength [MPa, range 0 to 800
- Key Entities (Bolt Sizes: M2.5, M3, M4, M5, M6, M8
Figure 11-18
- Title: Residual bolt strength under sustained loads, MP35N STA
- Material Properties: YS = 1750 MPa; = 3650 MPa
- X-axis: Crack depth 'a' [mm, range 0 to 6
- Y-axis: Residual Strength [MPa, range 0 to 2000
- Key Entities (Bolt Sizes: M2.5, M3, M4, M5, M6, M8
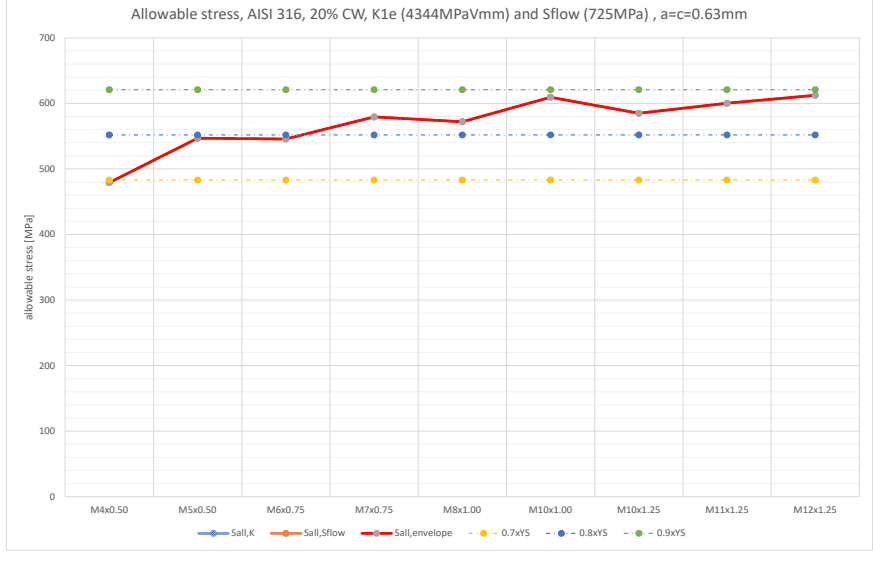
Figure description:
Allowable stress for various thread sizes AISI 316, 20% CW, K1e (4344MPaVmm and Sflow (725MPa , a=c=0.63mm
Allowable stress, AISI 316, 20% CW, K1e (4344MPaVmm and Sflow (725MPa , a=c=0.63mm
Legend
- Sall,K — color: light blue; symbol: solid line with circles
- Sall,Sflow — color: orange; symbol: solid line with circles
- Sall,envelope — color: red; symbol: solid line with grey circles
- 0.7xYS — color: yellow; symbol: dashed line with circles
- 0.8xYS — color: blue; symbol: dashed line with circles
- 0.9xYS — color: green; symbol: dashed line with circles
| Thread Size | Sall,K [MPa | Sall,Sflow [MPa | Sall,envelope [MPa | 0.7xYS [MPa | 0.8xYS [MPa | 0.9xYS [MPa |
|---|---|---|---|---|---|---|
| M4x0.50 | null | 480 | 480 | 483 | 552 | 621 |
| M5x0.50 | 546 | null | 546 | 483 | 552 | 621 |
| M6x0.75 | 545 | null | 545 | 483 | 552 | 621 |
| M7x0.75 | null | null | 579 | 483 | 552 | 621 |
| M8x1.00 | null | null | 572 | 483 | 552 | 621 |
| M10x1.00 | null | null | 609 | 483 | 552 | 621 |
| M10x1.25 | null | null | 585 | 483 | 552 | 621 |
| M11x1.25 | null | null | 600 | 483 | 552 | 621 |
| M12x1.25 | null | null | 613 | 483 | 552 | 621 |
Notes: The data indicates that the allowable stress envelope (Sall,envelope is determined by different criteria depending on the thread size, as shown by the changing marker colors on the red curve. The yield strength (YS for these calculations appears to be 690 MPa.))
YS=690MPa; K1e=4345MPa√mm
Figure 11-17 – Residual bolt strength under sustained loads, AISI 316 stainless steel

Figure description:
Allowable stress, MP35N STA, K1e (3649MPaVmm and Sflow (1820MPa , a=c=0.63mm
Allowable stress, MP35N STA, K1e (3649MPaVmm and Sflow (1820MPa , a=c=0.63mm
Legend
- Sall,K — color: light blue; symbol: Solid line with circle
- Sall,Sflow — color: orange; symbol: Solid line with circle
- Sall,envelope — color: red; symbol: Solid line (with gray circle markers in plot
- 0.7xYS — color: yellow; symbol: Dashed line with circle
- 0.8xYS — color: blue; symbol: Dashed line with circle
- 0.9xYS — color: green; symbol: Dashed line with circle
| Thread Size | Sall,envelope [MPa | 0.7xYS [MPa | 0.8xYS [MPa | 0.9xYS [MPa |
|---|---|---|---|---|
| M4x0.50 | 1205 | 1225 | 1400 | 1575 |
| M5x0.50 | 1375 | 1225 | 1400 | 1575 |
| M6x0.75 | 1370 | 1225 | 1400 | 1575 |
| M7x0.75 | 1455 | 1225 | 1400 | 1575 |
| M8x1.00 | 1435 | 1225 | 1400 | 1575 |
| M10x1.00 | 1530 | 1225 | 1400 | 1575 |
| M10x1.25 | 1470 | 1225 | 1400 | 1575 |
| M11x1.25 | 1505 | 1225 | 1400 | 1575 |
| M12x1.25 | 1535 | 1225 | 1400 | 1575 |
Notes: The Y-axis represents allowable stress in MPa, ranging from 0 to 1800 with major grid lines every 200 units and minor grid lines every 50 units. The series 0.7xYS, 0.8xYS, and 0.9xYS are constant across all thread sizes. Sall,envelope is represented by a thick red line connecting gray circular data points. Legend items Sall,K and Sall,Sflow are listed but their corresponding unique data series are not distinctly visible separate from the YS threshold lines.
YS=1750MPa; K1e=3650MPa√mm
Figure 11-18 – Residual bolt strength under sustained loads, MP35N STA
11.3.2 The Stress Intensity Factor
Fracture Mechanics theory is still under development and a number of different approaches can be found in the literature. The most well-established and useful concept is the stress intensity factor, a parameter used to characterise the stress distribution around a crack tip.
The stress intensity is the basis of Linear Elastic Fracture Mechanics (LEFM) theory, which applies in cases of plane strain such as a radial crack propagating from a fastener thread root.
From Reference 11.5, the stress intensity factor is given by,
where KI is the stress intensity factor for the tensile opening mode (as opposed to KII and KIII for the shear and torsion crack opening modes), 𝜎𝜎 is the gross axial fastener stress (calculated using the fastener’s nominal cross-sectional area, A), a is the crack length measured radially into the bolt, and F is the stress intensity correction factor (accounts for the geometry and location of the crack).
To develop an LEFM analysis using Equation [11.3.1] it is assumed an initial crack length, a0 , either from knowledge of the initial crack size or from an estimation of the largest crack that can escape detection with the relevant NDI techniques. The equation can be used to calculate the stress intensity factor for a cracked component, and allows estimation of either the critical static stress corresponding to the crack length, or the instantaneous stress intensity for dynamic loading crack growth analysis.
11.3.3 The Stress Intensity Correction Factor
11.3.3.1 Overview
This section is based on an older version of the NASGRO software (Ref. [11.3] or [11.4]) as well as other literature and will not be fully up to date with the latest NASGRO version (Ref. [11.9]). Cracked fastener models are still being further developed.
In a fastener subjected to both tensile and bending loads the correction factor for stress intensity factor is calculated by,
where and are the tensile and bending components of the normal stress at the crack location (see Section 11.3.3.2 below), and, and are that amplification factors specific to the tensile and bending stress fields respectively.
The following three types of cracks are most likely to occur in fasteners:
circumferential crack at the thread (most likely in fasteners with cut threads),
thumbnail crack at the thread (most likely in fasteners with rolled threads loaded in bending), and thumbnail cracks at the fillet under the fastener head
The ESACRACK/NASGRO software calculates stress intensity factors for these and other crack types, including those mentioned in this section. The following sections briefly describe the theory adopted by ESACRACK/NASGRO.
11.3.3.2 Components of Local Stress
In Equation [11.3.2] the tensile and bending components of the local bending stress at the crack are given by,
and,
where Fb is the tensile force in the fastener, Mb is the bending moment in the fastener, and dlocal is the assumed local diameter of the fastener at the crack location, which is either:
- • d for circumferential cracks, or
- • for thumbnail cracks
11.3.3.3 Circumferential Cracks around the Thread
Figure 11-19 shows the assumed stress distributions (left) and geometry (right) of the ESACRACK/NASGRO model for circumferential fastener cracks.

Figure description:
Title: SC09
Visual Entities:
- Top Left Diagram: Side view of a threaded fastener in a material, labeled with tensile stress and bending moment .
- Bottom Left Diagram: Cross-section of the fastener showing:
- : Major diameter.
- : Thread depth.
- : Dimension encompassing the thread and crack.
- "crack": Pointed to a circumferential line around the core.
- Top Right Diagram: Side view of a threaded fastener engaged with a "nut," labeled with stress and bending moment .
Variables and Definitions:
- = Major diameter
- = Thread depth
- and are based on
Formula:
Damaged Out Thread
Figure 11-19 - ESACRACK Model of a Circumferential Crack
The following equations are used by ESACRACK/NASGRO to determine the stress intensity correction factors for circumferential cracks in the fastener thread:
where; , , And,
[11.3.6]
where;
11.3.3.4 Thumbnail Cracks at the Thread Root
Figure 11-20 shows the assumed stress distributions (left) and geometry (right) of the ESACRACK/NASGRO model for thumbnail fastener cracks.

Figure description:
- Header: SC08
- Diagrams:
- Left image: A fastener with a "crack" at the thread root, subject to uniform stress .
- Right image: A fastener and "nut" assembly with a crack, subject to bending stress .
- Bottom center cross-section: Shows geometric parameters (crack depth, (crack arc length, (major diameter, and .
- Geometric Definitions:
- Equations and Relationships:
- and are based on .
Rolled threads - Crack at first contact thread
Figure 11-20 - ESACRACK Model of a Thumbnail Crack
For this type of crack, the stress intensity correction factors for tension (F 0) and bending (F 1) are shown in Table 11-1 (from Reference 11.3).
| a/d | Tension Correction Factor (F0) | Bending Correction Factor (F1) | ||
|---|---|---|---|---|
| a/c = 0,645 | a/c = 1,0 | a/c = 0,645 | a/c = 1,0 | |
| 0,0 | Ktfx | 1,00 | Ktfx | 0,60 |
| 0,05 | - | 0,84 | - | 0,54 |
| 0,1 | 0,95 | 0,76 | 0,61 | 0,48 |
| 0,2 | 0,90 | 0,65 | 0,54 | 0,37 |
| 0,3 | 0,98 | 0,59 | 0,55 | 0,31 |
| 0,4 | 1,29 | 0,62 | 0,64 | 0,30 |
| 0,5 | 2,05 | 1,0 | 0,84 | 0,50 |

Figure description:
Entities:
- Bolt Head: The upper horizontal component.
- Shank: The vertical cylindrical component below the head.
- Fillet: The curved transition region between the bolt head and the shank.
- Crack: A semi-elliptical "thumbnail" flaw located at the fillet.
Geometric Parameters:
- d: Shank diameter.
- D: Bolt head diameter.
- R: Fillet radius.
- a: Depth of the crack.
- c: Half-length of the crack along the surface.
- : Applied tensile stress acting vertically on the shank.
Key Visual Details:
- The diagram illustrates a cross-section of a tension bolt with a crack originating at the fillet radius .
- Dimensions , , and define the bolt geometry.
- Dimensions and define the crack size and shape.
- Tensile loading is indicated by the vectors.
For it is important to use interpolation.
For the case of no crack (i.e. ) the stress intensity correction factor is determined by the stress concentration factor , which can be interpolated from Table 11-2, and an extra factor, , which is given by,
| r/d | 0,005 | 0,01 | 0,015 | 0,02 | 0,025 | 0,03 | 0,035 | 0,04 | 0,045 | 0,05 |
|---|---|---|---|---|---|---|---|---|---|---|
| K₁ | 10,8 | 7,89 | 6,55 | 5,73 | 5,17 | 4,77 | 4,48 | 4,19 | 3,97 | 3,79 |
| r/d | 0,055 | 0,06 | 0,065 | 0,07 | 0,075 | 0,08 | 0,085 | 0,09 | 0,095 | 0,10 |
| K₁ | 3,63 | 3,49 | 3,37 | 3,26 | 3,16 | 3,07 | 2,97 | 2,91 | 2,84 | 2,78 |
11.3.3.5 Thumbnail Crack at Fillet Under Fastener Head
Figure 11-21 shows this type of crack.
SC14
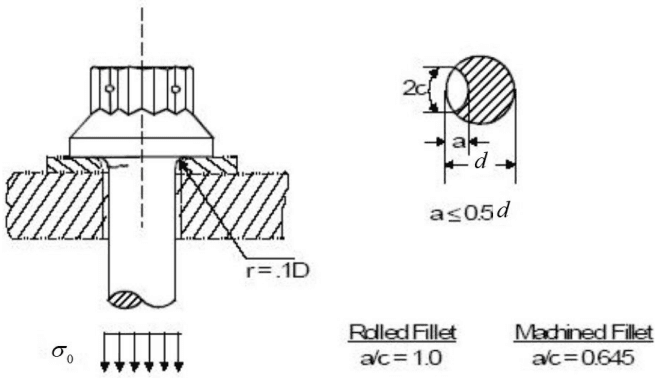
Figure description:
Entities
- Fastener: A bolt with a splined head and a cylindrical shank.
- Fillet Crack: A crack located at the junction (fillet between the bolt head and shank.
- Substrate: The material through which the bolt passes.
- Cross-section: A circular view of the bolt shank showing the thumbnail crack geometry.
Key Parameters and Geometry
- Fillet Radius (:
- Tensile Stress: Indicated by and downward arrows.
- Crack Depth:
- Shaft Diameter:
- Crack Width:
- Geometric Constraint:
Crack Aspect Ratios (
- Rolled Fillet:
- Machined Fillet:
Tension Bolt - Crack in Bolt Head Fillet
Figure 11-21 - ESACRACK Model of a Fillet Crack under a Fastener HeadThe stress intensity factors for this type of crack are calculated as for a thumbnail crack at the thread root in Section 11.3.3.4 above except the following additional assumptions are made:
- • For a machined fillet a/c = 0,645
- • For a rolled fillet a/c = 1,0
- • r/d = 0,1
- • For a/d = 0 the stress concentration factor of 2,78 is used
- • For a/d = 0,05 smooth interpolation is used
11.3.4 Crack Growth Calculations
To predict safe life for a particular potential fracture critical (PFCI) fastener it is necessary to assume an initial crack size, calculate the stress intensity at the first load cycle, calculate the change in crack length due to that cycle and then calculate a new stress intensity. Comparison of this with the critical value for the material, KIC or KISCC , can determine if failure can occur. If not, the next cycle can be calculated and the process repeated until the critical crack length is reached.
As this process can extend over thousands of cycles it is generally beyond the scope of hand calculations and the use of computer-based methods such as ESACRACK/NASGRO are advised.
NAGRO provides added ability to include effects of preload on bolted joint analysis for crack case SC08 (crack at first contact thread) and SC14 (semi-elliptical surface crack in bolt head fillet).
As an example of the procedure, the SC08 crack solution needs the following inputs:
- • Tensile stress,
- • Bolt preload value, P (in kip or Newton)
- • Length of the grip (combined member thicknesses), L
- • Threaded part of grip length, Lt
- • Elastic Modulus of bolt, Eb
- • Elastic Modulus of members, Em
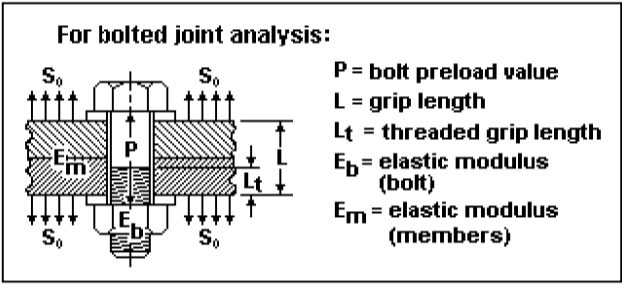
Figure description:
Title: For bolted joint analysis:
Diagram Entities and Labels:
- Bolt assembly: Includes bolt head, shank, nut, and threads.
- Members: Two plates clamped together with elastic modulus .
- : Applied tensile stress arrows acting on the members.
- : Bolt preload value, indicated by internal vertical arrows in the bolt shank.
- : Grip length.
- : Threaded grip length.
- : Elastic modulus (bolt.
Key Parameters:
- P = bolt preload value
- L = grip length
- = threaded grip length
- = elastic modulus (bolt
- = elastic modulus (members
Figure 11-10 – NASGRO inputs for the bolt analysis, SC08 case
The code computes stiffnesses and net axial stress of bolt and members, and the stress intensity factor with corresponding crack growth.
The approach is explained in Annex N of the NASGRO manual and based on Shigley, J.E. and Mischke, C. R., “Mechanical Engineering Design (in SI Units),” Sixth Edition, Tata McGraw-Hill Book Company, 2003.
It is up to the user to ensure that the stress cycles generated by NASGRO are consistent with those calculated in the stress analysis, using the guidelines of this handbook. Alternatively, a spectrum can be derived using the ESALOAD software (Ref. [11.2]).
11.3.5 Corrosion Considerations
The principal means by which corrosion affects the fatigue life is the formation of pits, which create geometric stress concentrations in the same areas as a chemically degraded metallic surface. Many of the same features that affect basic fatigue life are also corrosive. Therefore, good design against fatigue also eliminates many possible corrosion hazards.
|
Good fatigue performances need avoidance of stress corrosion cracking (SCC, or more generally environmentally assisted cracking, EAC) at locations in the joint where corrosion is likely. The elimination of residual tensile stress, as well as adequate corrosion protection and the correct choice of material is essential.
Reference 11.9 provides some information about susceptibility to stress corrosion cracking of some materials in the presence of cracks. These are generally considered as indicative, but need to be confirmed by test for critical applications, see also e.g. Reference 11.17. It has been shown that with some materials there is a threshold value, below which stress corrosion cracking cannot occur. This threshold is denoted KISCC (or, more generally, KEAC ) and is a material property, which can be measured. However, the threshold can depend on many factors, and only a limited number of threshold values can be found in literature.
It is important to note that KEAC is dependent upon the environment. Therefore, comparison between different materials and/or different environments can be incorrect.
The combined effect of corrosion and fatigue is a more rapid failure than either acting alone. This is called corrosion fatigue. The calculation of the effect of corrosion on fatigue life is not possible in the original design calculations. To make the design calculations realistic it is essential to ensure that the possibility of corrosion is minimised and later to assess the effect of salvage schemes if they become necessary.
More information on corrosion can be found in Section 13.