7.1.1
Common hot rolled and built-up steel members used for carrying axial compression, usually fail by flexural buckling. The buckling strength of these members is affected by residual stresses, initial bow and accidental eccentricities of load. To account for all these factors, the strength of members subjected to axial compression is defined by buckling class a, b, c, or d as given Table 7.
7.1.2
The design compressive strength , of a member is given by:
where
where
7.1.2.1
The design compressive stress, , of axially loaded compression members shall be calculated using the following equation:
where
- non-dimensional effective slenderness ratio
where
- effective slenderness ratio or ratio of effective length, to appropriate radius of gyration, ;
- imperfection factor given in Table 7;
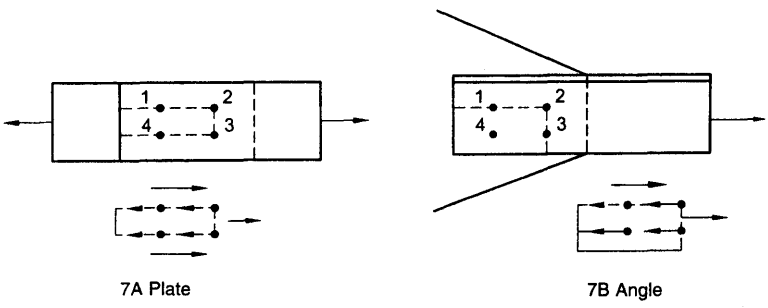
Figure description:
FIG. 7 BLOCK SHEAR FAILURE
-
7A Plate: Illustrates block shear failure in a flat steel plate.
- Entities: Four bolts (labeled 1-4 in a rectangular pattern.
- Mechanism: Tensile force pulls a block of material out. Dashed lines indicate failure paths: longitudinal shear planes through bolt holes and a transverse tension plane between bolts 2 and 3.
- Force Diagram: Small inset shows shear forces acting along the sides and tension acting at the rear of the failing block.
-
7B Angle: Illustrates block shear failure in an L-shaped angle section.
- Entities: Four bolts (labeled 1-4 positioned on one leg of the angle.
- Mechanism: Tension causes failure along a path through the bolts to the edge of the section.
- Force Diagram: Inset shows the combination of shear along the longitudinal bolt line and tension across the path leading to the member's edge.
FIG. 7 BLOCK SHEAR FAILURE
NOTE — Calculated values of design compressive stress, for different buckling classes are given in Table 9.
7.1.2.2
The classification of different sections under different buckling class a, b, c or d, is given in Table 10. The stress reduction factor , and the design compressive stress , for different buckling class, yield stress, and effective slenderness ratio is given in Table 8 for convenience. The curves corresponding to different buckling class are presented in non-dimensional form, in Fig. 8.
Table 7 Imperfection Factor,
(Clauses 7.1.1 and 7.1.2.1)
| Buckling Class | a | b | c | d |
|---|---|---|---|---|
| α | 0.21 | 0.34 | 0.49 | 0.76 |