The design fatigue strength for life cycles may be obtained from the standard fatigue strength for cycles by multiplying with correction factor for thickness, as mentioned in 13.2.1 and dividing by partial safety factor given in Table 25.
13.5.1 Exemptions
At any point in a structure if the actual normal and shear stress range and are less than the design fatigue strength range corresponding to cycles with appropriate partial safety factor, no further assessment for fatigue is necessary at that point.
13.5.2 Stress Limitations
13.5.2.1
The maximum (absolute) value of the normal and shear stresses shall never exceed the elastic limit for the material under cyclic loading.
13.5.2.2
The maximum stress range shall not exceed for normal stresses and for the shear stresses under any circumstance.
13.5.2.3 Constant stress range
The actual normal and shear stress range and at a point of the structure subjected to cycles in life shall satisfy.
where
-
correction factor (see 13.2.1),
-
-
normal and shear fatigue strength ranges for the actual life cycle, , obtained from 13.4.
13.5.2.4 Variable stress range
Fatigue assessment at any point in a structure, wherein variable stress ranges or for number of cycles to ) are encountered, shall satisfy the following:
a) For normal stress ()
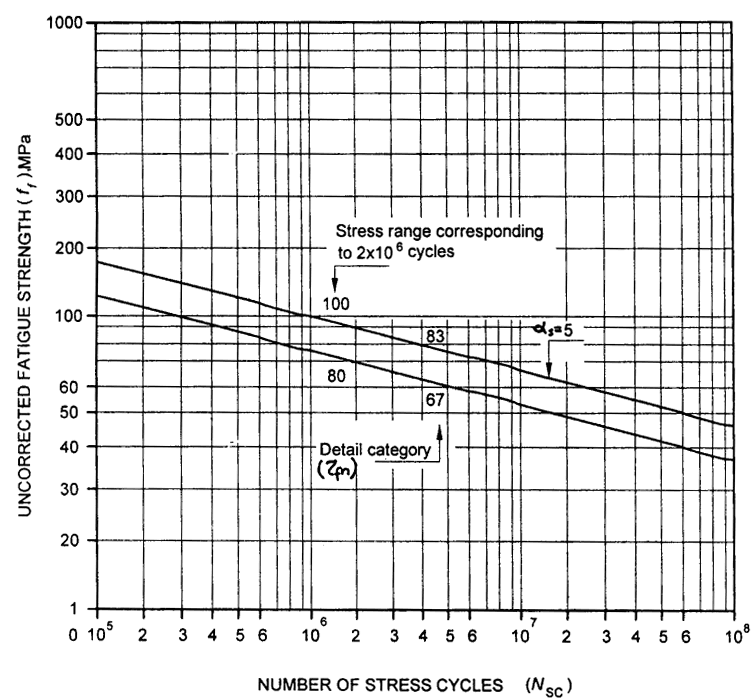
Figure description:
Uncorrected Fatigue Strength Design Chart
Uncorrected Fatigue Strength vs Number of Stress Cycles
Legend
- Detail category 100 — color: black; symbol: solid line
- Detail category 80 — color: black; symbol: solid line
Annotations
- Stress range corresponding to cycles (vertical_line - position: x = 2e6)
- Detail category (\zeta_{rn} (text_label - position: pointing to intersection points at 2e6 and 5e6 cycles))
- (text_label - position: between the two lines near x = 2e7, indicating slope exponent)
- 100 (text_label - position: x = 2e6, y = 100)
- 80 (text_label - position: x = 2e6, y = 80)
- 83 (text_label - position: x = 5e6, y = 83)
- 67 (text_label - position: x = 5e6, y = 67)
| Number of Stress Cycles () | Fatigue Strength (), MPa (Detail category 100) | Fatigue Strength (), MPa (Detail category 80) |
|---|---|---|
| 182 | 146 | |
| 158 | 127 | |
| 132 | 106 | |
| 115 | 92 | |
| 100 | 80 | |
| 83 | 67 | |
| 73 | 58 | |
| 46 | 37 |
Notes: The chart is a log-log plot showing fatigue strength as a function of the number of stress cycles. The curves follow a power law relationship with . The labeled points 100, 80, 83, and 67 correspond to specific stress ranges at and cycles. The detail category (\zeta_{rn} is defined by the stress range at cycles.)
FIG. 23 S-N CURVE FOR SHEAR STRESS
b) For shear stresses (τ)
where is the summation upper limit of all the normal stress ranges having magnitude lesser than for that detail and the lower limit of all the normal stress ranges having magnitude greater than for the detail. In the above summation all normal stress ranges, , and having magnitude less than , and may be disregarded.