38.1 Assumptions
Design for the limit state of collapse in flexure shall be based on the assumptions given below:
- a) Plane sections normal to the axis remain plane after bending.
- b) The maximum strain in concrete at the outermost compression fibre is taken as 0.0035 in bending.
- c) The relationship between the compressive stress distribution in concrete and the strain in concrete may be assumed to be rectangle, trapezoid, parabola or any other shape which results in prediction of strength in substantial agreement with the results of test. An acceptable stress-strain curve is given in Fig. 21. For design purposes, the compressive strength of concrete in the structure shall be assumed to be 0.67 times the characteristic strength. The partial safety factor shall be applied in addition to this.
NOTE — For the stress-strain curve in Fig. 21 the design stress block parameters are as follows (see Fig. 22):
Area of stress block
Depth of centre of compressive force = 0.42 x
from the extreme fibre in compression where
- d) The tensile strength of the concrete is ignored.
e) The stresses in the reinforcement are derived
- from representative stress-strain curve for the type of steel used. Typical curves are given in Fig. 23. For design purposes the partial safety factor , equal to 1.15 shall be applied.
- f) The maximum strain in the tension reinforce- ment in the section at failure shall not be less than:
where
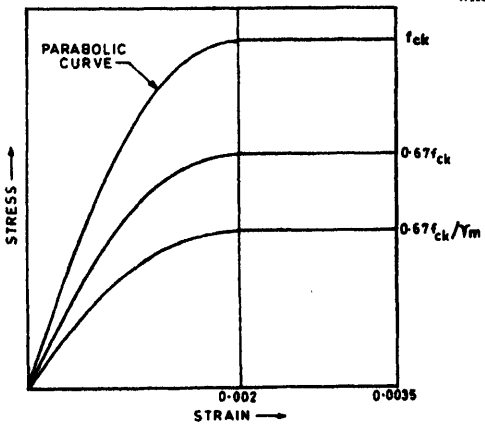
Figure description:
Stress-Strain Relationship for Concrete
Stress-Strain Curve for Concrete
Legend
- fck (Characteristic strength — color: black; symbol: Solid line
- 0.67 fck — color: black; symbol: Solid line
- 0.67 fck / γm (Design strength — color: black; symbol: Solid line
Annotations
- PARABOLIC CURVE (text_label - position: Points to the curve between strain 0 and 0.002)
- 0.002 (vertical_line - position: x = 0.002)
| Strain | Stress () | Stress () | Stress () |
|---|---|---|---|
| 0 | 0 | 0 | 0 |
| 0.001 | |||
| 0.002 | |||
| 0.0035 |
Notes: The chart represents the idealized stress-strain relationship for concrete as per design codes like IS 456. The curves are parabolic from strain 0 to 0.002 and then remain constant (plateau until the ultimate failure strain of 0.0035.)
FIG. 21 STRESS-STRAIN CURVE FOR CONCRETE
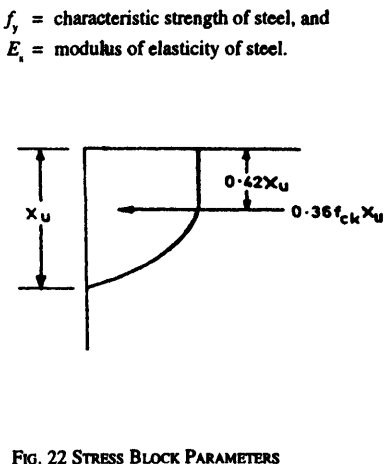
Figure description:
Image Content: Stress Block Parameters (Fig. 22
- : Characteristic strength of steel
- : Modulus of elasticity of steel
- : Depth of the neutral axis
- : Distance from the extreme compression fiber to the centroid of the compressive force
- : Total compressive force in the concrete stress block (where is characteristic compressive strength of concrete
- Diagram: Illustrates the parabolic-rectangular stress distribution in a concrete section under compression.
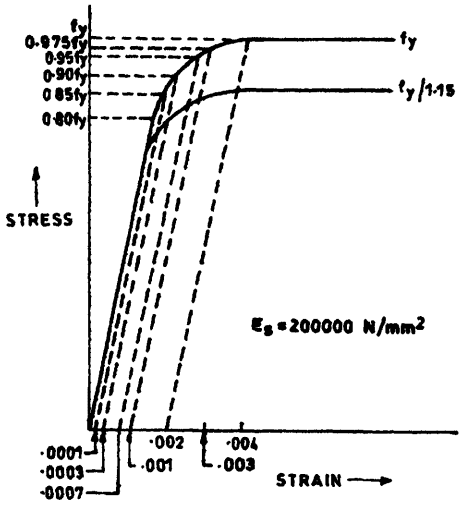
Figure description:
Stress-Strain Relationship for Steel Reinforcement
Representative Stress-Strain Curve for Steel
Legend
- Characteristic curve (fy — color: black; symbol: Solid line (upper
- Design curve (fy/1.15 — color: black; symbol: Solid line (lower
Annotations
- Es = 200000 N/mm2 (text_label - position: bottom right, above strain axis)
- Offset lines (dashed_line - position: Parallel to initial slope, intersecting x-axis at labeled offset values)
- fy/1.15 (text_label - position: y = 0.87 fy)
| Plastic Offset Strain | Characteristic Stress (units of fy) | Design Stress (units of fy) |
|---|---|---|
| 0.0001 | 0.80 | - |
| 0.0003 | 0.85 | - |
| 0.0007 | 0.90 | - |
| 0.0010 | 0.95 | - |
| 0.0020 | 0.975 | 0.870 (fy/1.15) |
| (Plateau corner) | 1.00 | 0.870 (fy/1.15) |
Notes: The chart illustrates the characteristic and design stress-strain curves for steel, typically used in structural design (e.g., cold-worked bars in IS 456. The x-axis shows plastic offset strains labeled as .0001, .0003, .0007, .001, .002, .003, and .004. The y-axis shows stress as a fraction of the characteristic yield strength (fy. Dashed lines indicate the points on the curves corresponding to these offsets, assuming a Young's modulus (Es of 200,000 N/mm².)))
23A Cold Worked Deformed Bar
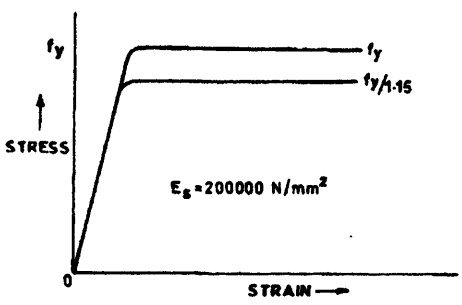
Figure description:
Stress-Strain Relationship of Steel Reinforcement (BS 8110 / EC2 style International Standard Style Chart. Idealized stress-strain curve for reinforcement steel. The upper curve represents the characteristic yield strength, and the lower curve represents the design yield strength, reduced by a partial safety factor for steel (1.15. The initial slope is the elastic modulus Es = 200,000 N/mm^2.
Stress-Strain Curve for Reinforcement Steel
Legend
- fy — color: black; symbol: Solid line (upper curve
- fy/1.15 — color: black; symbol: Solid line (lower curve
Annotations
- Es = 200000 N/mm^2 (text_label - position: mid-plot area)
- fy (text_label - position: y-axis at upper plateau)
- STRESS (axis_label - position: y-axis)
- STRAIN (axis_label - position: x-axis)
| Strain | Stress (fy curve) | Stress (fy/1.15 curve) |\n| :--- | :--- | :--- |\n| 0 | 0 | 0 |\n| fy / (1.15 * 200000) | fy / 1.15 | fy / 1.15 |\n| fy / 200000 | fy | fy / 1.15 |\n| > fy / 200000 | fy | fy / 1.15 |
23B STEEL BAR WITH DEFINITE YIELD POINT
FIG. 23 REPRESENTATIVE STRESS-STRAIN CURVES FOR REINFORCEMENT
NOTE — The limiting values of the depth of neutral axis for different grades of steel based on the assumptions in 38.1 are as follows:
| fy | xu,max / d |
|---|---|
| 250 | 0.53 |
| 415 | 0.48 |
| 500 | 0.46 |
The expression for obtaining the moments of resistance for rectangular and T-Sections, based on the assumptions of 38.1, are given in Annex G.