A method of calculating the measurement uncertainty for room temperature tensile testing using an "Error Budget" concept has been outlined and examples given for a few materials where the material response to the testing parameters is known. It should be noted that the calculated uncertainties may need to be modified to include a weighting factor in accordance with the guide to the expression of uncertainty in measurement [2] and this will be undertaken when the Eurolab and ISO working parties finalise their recommendations on the optimum approach to be adopted. In addition, there are other factors that can affect the measurement of tensile properties such as test piece bending, methods of gripping the test piece, or the testing machine control mode, i.e., extensometer control or load/crosshead control which may affect the measured tensile properties [6]. However since there is insufficient quantitative data available it is not possible to include their effects in error budgets at present. It should also be recognised that this error budget approach only gives an estimate of the uncertainty due to the measurement technique and does not make an allowance for the inherent scatter in experimental results attributable to material inhomogeneity.
Finally, it should be appreciated that when suitable reference materials become available they will offer a useful means of measuring the total measurement uncertainty on any given testing machine including the influence of grips, bending, etc, which at present have not been quantified.
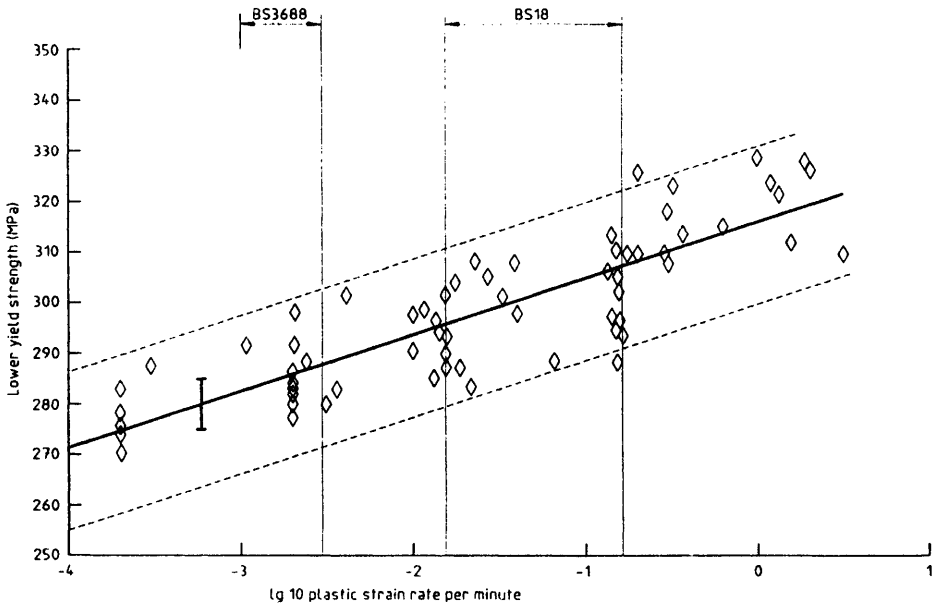
Figure description:
Yield Strength Variation with Strain Rate
Lower yield strength vs lg 10 plastic strain rate per minute
Legend
- Experimental data — color: black; symbol: Diamonds
- Linear regression — color: black; symbol: Solid line
- Uncertainty bounds — color: black; symbol: Dashed lines
Annotations
- BS3688 (horizontal_range - position: x = -3.3 to -2.5)
- BS18 (horizontal_range - position: x = -1.8 to -0.8)
- Standard Error Bar (vertical_line - position: x = -3.2, y = 275 to 285)
| lg 10 plastic strain rate per minute | Lower yield strength (MPa - Experimental) | Regression Line (MPa) | Upper Bound (MPa) | Lower Bound (MPa) |
|---|---|---|---|---|
| -4.0 | 271.5 | 286.5 | 255.5 | |
| -3.7 | 270 | |||
| -3.7 | 274 | |||
| -3.7 | 275 | |||
| -3.7 | 276 | |||
| -3.7 | 278 | |||
| -3.7 | 283 | |||
| -3.5 | 287 | |||
| -3.2 | ||||
| -3.0 | 292 | |||
| -2.7 | 277 | |||
| -2.7 | 280 | |||
| -2.7 | 281 | |||
| -2.7 | 282 | |||
| -2.7 | 283 | |||
| -2.7 | 285 | |||
| -2.7 | 288 | |||
| -2.7 | 292 | |||
| -2.7 | 298 | |||
| -2.5 | 280 | |||
| -2.5 | 283 | |||
| -2.4 | 301 | |||
| -2.0 | 290 | |||
| -2.0 | 297 | |||
| -1.9 | 298 | |||
| -1.8 | 285 | |||
| -1.8 | 287 | |||
| -1.8 | 290 | |||
| -1.8 | 293 | |||
| -1.8 | 295 | |||
| -1.8 | 297 | |||
| -1.8 | 298 | |||
| -1.8 | 301 | |||
| -1.8 | 303 | |||
| -1.8 | 308 | |||
| -1.7 | 287 | |||
| -1.7 | 289 | |||
| -1.6 | 308 | |||
| -1.5 | 283 | |||
| -1.5 | 305 | |||
| -1.4 | 301 | |||
| -1.3 | 298 | |||
| -1.3 | 308 | |||
| -1.1 | 288 | |||
| -0.8 | 288 | |||
| -0.8 | 294 | |||
| -0.8 | 296 | |||
| -0.8 | 297 | |||
| -0.8 | 303 | |||
| -0.8 | 306 | |||
| -0.8 | 313 | |||
| -0.8 | 302 | |||
| -0.8 | 306 | |||
| -0.8 | 309 | |||
| -0.8 | 310 | |||
| -0.7 | 308 | |||
| -0.7 | 309 | |||
| -0.6 | 325 | |||
| -0.5 | 308 | |||
| -0.5 | 310 | |||
| -0.5 | 318 | |||
| -0.5 | 323 | |||
| -0.4 | 314 | |||
| -0.2 | 315 | |||
| 0.0 | 328 | 315.5 | 330.5 | 300.5 |
| 0.1 | 323 | |||
| 0.1 | 324 | |||
| 0.2 | 321 | |||
| 0.3 | 312 | |||
| 0.3 | 327 | |||
| 0.3 | 328 | |||
| 0.4 | 326 | |||
| 0.5 | 310 | 321.1 | 336.1 | 305.5 |
Notes: The chart shows the relationship between lower yield strength (MPa and the log10 plastic strain rate per minute, featuring multiple data points clustered at specific strain rates. Two standard testing ranges, BS3688 and BS18, are highlighted on the x-axis.)
Key
I Maximum expected error in stress
Figure J.1 — Variation of lower yield strength (ReL) at room temperature as a function of strain rate, for plate steel [6]
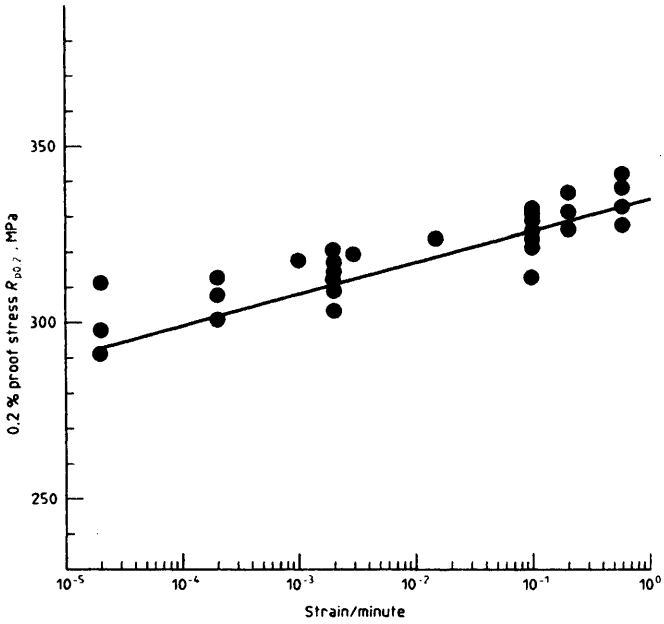
Figure description:
Relationship between 0.2 % proof stress and strain rate
0.2 % proof stress Rp0.2 vs Strain/minute
Legend
- Experimental Data — color: black; symbol: Circles
- Linear Fit — color: black; symbol: Solid line
| Strain/minute | Experimental 0.2 % proof stress Rp0.2 (MPa) | Linear Fit 0.2 % proof stress Rp0.2 (MPa) |
|---|---|---|
| 0.00001 | 291 | |
| 0.00002 | 291 | |
| 0.00002 | 298 | |
| 0.00002 | 312 | |
| 0.0001 | 300 | |
| 0.0002 | 301 | |
| 0.0002 | 308 | |
| 0.0002 | 313 | |
| 0.001 | 318 | 309 |
| 0.002 | 304 | |
| 0.002 | 310 | |
| 0.002 | 313 | |
| 0.002 | 314 | |
| 0.002 | 316 | |
| 0.002 | 318 | |
| 0.002 | 321 | |
| 0.003 | 320 | |
| 0.01 | 318 | |
| 0.015 | 325 | |
| 0.1 | 314 | 327 |
| 0.1 | 322 | |
| 0.1 | 325 | |
| 0.1 | 326 | |
| 0.1 | 328 | |
| 0.1 | 330 | |
| 0.1 | 332 | |
| 0.1 | 334 | |
| 0.2 | 328 | |
| 0.2 | 332 | |
| 0.2 | 338 | |
| 0.6 | 329 | |
| 0.6 | 333 | |
| 0.6 | 338 | |
| 0.6 | 342 | |
| 0.6 | 344 | |
| 1.0 | 336 |
Notes: The chart illustrates the dependency of 0.2% proof stress (Rp0.2 on the strain rate, plotted on a semi-logarithmic scale. A linear trend line is fitted to the multiple experimental data points collected across several orders of magnitude of strain rate.)