The test report shall contain at least the following information:
- a) reference to this International Standard, i.e. ISO 6892;
- b) identification of the test piece;
- c) specified material, if known;
- d) type of test piece;
- e) location and direction of sampling of test pieces;
- f) measured properties and results.
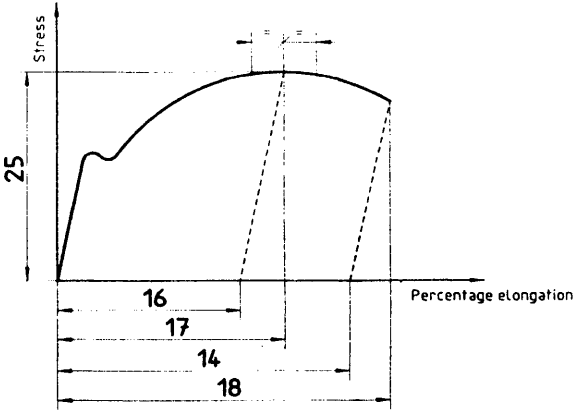
Figure description:
Stress vs. Percentage Elongation
Stress-Strain Curve with Labeled Elongation Parameters
Annotations
- 25 (text_label - position: y = peak stress level)
- 16 (dimension_line - position: x-axis distance from origin to base of dashed line from peak)
- 17 (dimension_line - position: x-axis distance from origin to perpendicular line from peak)
- 14 (dimension_line - position: x-axis distance from origin to base of dashed line from fracture)
- 18 (dimension_line - position: x-axis distance from origin to perpendicular line from fracture)
- Dashed lines parallel to elastic region (reference_line - position: Connect peak/fracture to x-axis)
| Feature / Label | Percentage Elongation (X) | Stress (Y) |
|---|---|---|
| Origin | 0 | 0 |
| Yield Point Region | Low positive value | Mid-high value |
| Maximum Stress (Ultimate Tensile Strength) | - | Label 25 |
| Peak of Curve | Label 17 | Label 25 |
| Permanent Elongation after Maximum Force | Label 16 | 0 |
| Fracture Point | Label 18 | (Below Label 25) |
| Permanent Elongation after Fracture | Label 14 | 0 |
Notes: The labels 14, 16, 17, 18, and 25 refer to standard mechanical testing parameters (likely based on ISO standards. Label 25 represents the Tensile Strength (). Labels on the x-axis represent various measures of elongation: 16 (), 17 (), 14 (), and 18 ().)
NOTE — See table 1 for explanation of reference numbers.
Figure 1 — Definitions of elongation
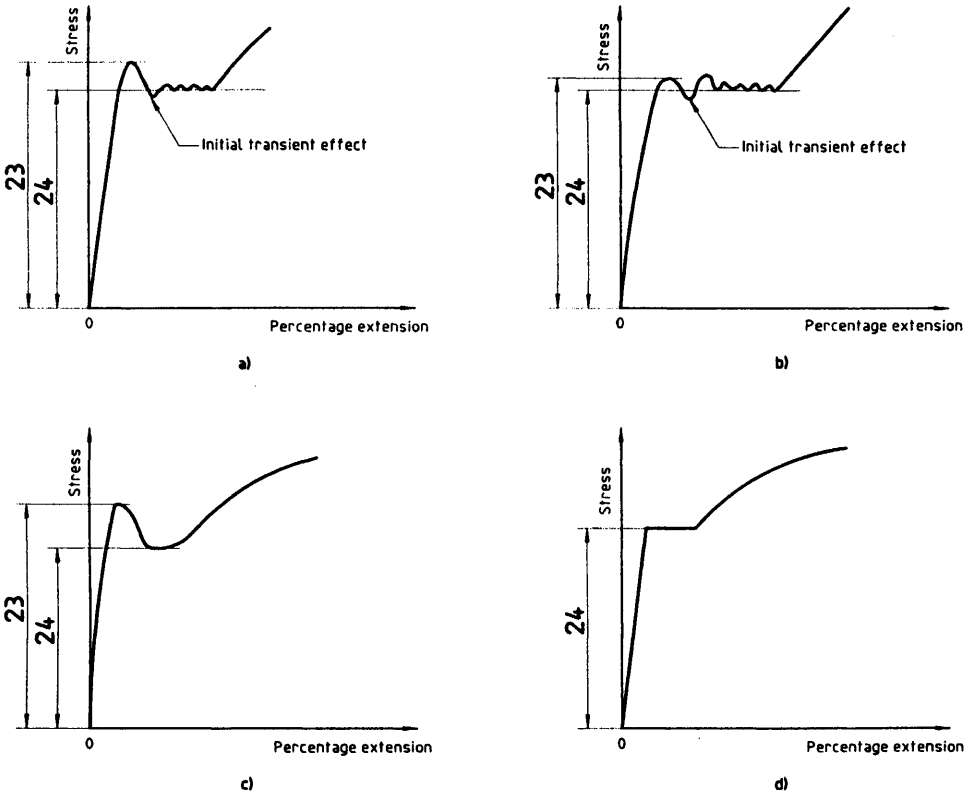
Figure description:
Stress vs. Percentage Extension Curves
a
Annotations
- Initial transient effect (text_label - position: x = 11.0, y = 21.5)
- 23 (vertical_line - position: y = 23.0 (Upper yield stress level))
- 24 (vertical_line - position: y = 24.0 (Lower yield stress level))
| Percentage extension | Stress |
|---|---|
| 0.0 | 0.0 |
| 8.0 | 23.0 |
| 11.0 | 21.5 (Initial transient effect) |
| 14.0 | 24.0 |
| 17.0 | 23.8 |
| 20.0 | 24.2 |
| 23.0 | 24.0 |
| 28.0 | 24.0 |
| 35.0 | 28.0 |
| 45.0 | 38.0 |
b
Annotations
- Initial transient effect (text_label - position: x = 11.0, y = 21.0)
- 23 (vertical_line - position: y = 23.0)
- 24 (vertical_line - position: y = 24.0)
| Percentage extension | Stress |
|---|---|
| 0.0 | 0.0 |
| 8.0 | 23.0 |
| 11.0 | 21.0 (Initial transient effect) |
| 14.0 | 24.5 |
| 17.0 | 23.5 |
| 20.0 | 24.5 |
| 23.0 | 23.5 |
| 26.0 | 24.5 |
| 30.0 | 24.0 |
| 40.0 | 32.0 |
| 50.0 | 45.0 |
c
Annotations
- 23 (vertical_line - position: y = 23.0)
- 24 (vertical_line - position: y = 24.0)
| Percentage extension | Stress |
|---|---|
| 0.0 | 0.0 |
| 10.0 | 23.0 |
| 15.0 | 22.0 |
| 22.0 | 24.0 |
| 35.0 | 24.0 |
| 50.0 | 35.0 |
| 65.0 | 42.0 |
d
Annotations
- 24 (vertical_line - position: y = 24.0)
| Percentage extension | Stress |
|---|---|
| 0.0 | 0.0 |
| 12.0 | 24.0 |
| 28.0 | 24.0 |
| 45.0 | 35.0 |
| 60.0 | 40.0 |
Notes: The figures illustrate variations in the yield point phenomenon during tensile testing. The labels '23' and '24' on the vertical axis denote the Upper Yield Stress and Lower Yield Stress levels, respectively. Panels (a and (b exhibit an 'Initial transient effect' with varying degrees of oscillation along the yield plateau. Panel (c shows a smooth transition from upper to lower yield points, while panel (d shows a distinct yield plateau without an upper yield point peak.))))
NOTE — See table 1 for explanation of reference numbers.
Figure 2 — Definitions of upper and lower yield strengths for different types of curves
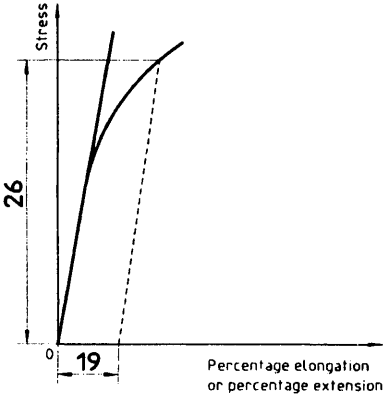
Figure description:
Mechanical Properties: Proof Stress Determination Method for Determining Proof Stress from a Stress-Strain Diagram
Stress vs. Percentage Elongation
Annotations
- 26 (text_label - position: y = 26 (y-axis offset indicating proof stress level))
- 19 (text_label - position: x = 19 (x-axis offset indicating percentage extension for proof stress calculation))
- Stress (axis_label - position: y-axis)
- Percentage elongation or percentage extension (axis_label - position: x-axis)
- Parallel dashed line (dashed_line - position: Starts at x=19 on the x-axis, parallel to the initial linear portion of the curve)
- Proof stress intersection (point - position: (27.67, 26))
| Percentage elongation or percentage extension | Stress (Main Curve) | Linear Extension of Elastic Region | Parallel Offset Line (Dashed) |
|---|---|---|---|
| 0 | 0 | 0 | null |
| 3 | 9 | 9 | null |
| 6 | 18 | 18 | null |
| 9 | 22 | 27 | null |
| 12 | 23.5 | 36 | null |
| 19 | 24.8 | null | 0 |
| 27.67 | 26 | null | 26 |
| 35 | 27.5 | null | 48 |
Notes: The figure illustrates the graphical method used to determine the proof stress of a material. A line is drawn parallel to the linear elastic region of the stress-strain curve, originating from a specific offset on the x-axis (labeled 19. The stress value (labeled 26 where this parallel line intersects the stress-strain curve is defined as the proof stress.))
NOTE -
See table 1 for explanation of reference numbers.
Figure 3 — Proof strength, non-proportional extension
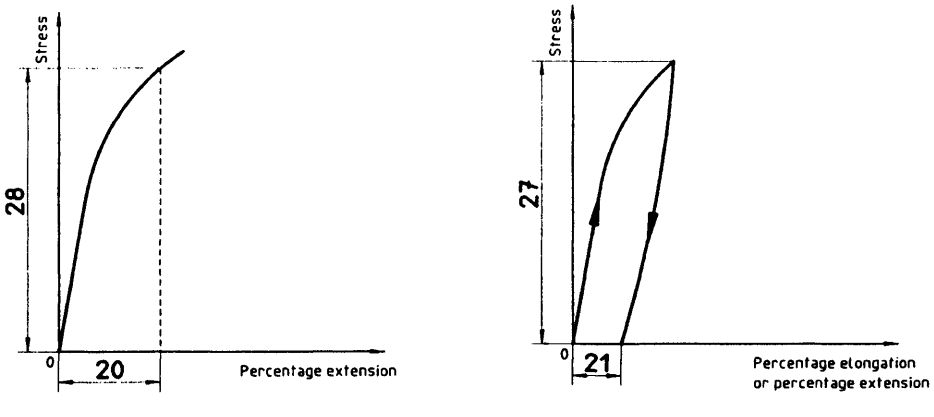
Figure description:
Stress vs. Percentage Extension/Elongation Plots
Stress-Extension Curve
Annotations
- 28 (y_axis_marker - position: y = 28)
- 20 (x_axis_marker - position: x = 20)
| Percentage extension | Stress |
|---|---|
| 0 | 0 |
| 10 | 19 |
| 20 | 28 |
| 25 | 33 |
Stress-Extension Hysteresis Cycle
Annotations
- 27 (y_axis_marker - position: y = 27)
- 21 (x_axis_marker - position: x = 21 (Permanent set))
| Percentage elongation or percentage extension | Loading Stress | Unloading Stress |
|---|---|---|
| 0 | 0 | null |
| 10 | 11 | null |
| 20 | 21 | null |
| 21 | null | 0 |
| 30 | null | 15 |
| 35 | 27 | 27 |
Notes: The figures display mechanical stress-strain relationships. The left graph shows a standard loading curve where a percentage extension of 20 corresponds to a stress of 28. The right graph depicts a hysteresis loop with arrows indicating the loading and unloading paths. The material reaches a peak stress of 27 at an estimated extension of 35% and, upon unloading, retains a permanent extension of 21%.
NOTE -
See table 1 for explanation of reference numbers.
Figure 4 — Proof strength, total extension
Figure 5 — Permanent set strength
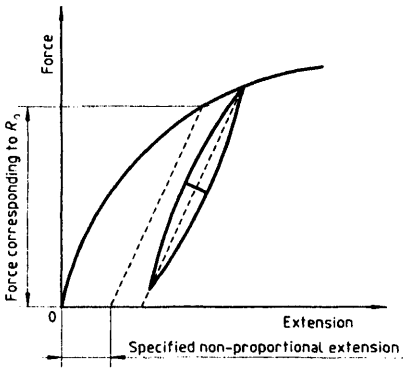
Figure description:
Determination of Proof Strength and Hysteresis Loop
Force vs. Extension Curve showing Determination of Proof Strength (Rp
Annotations
- Force corresponding to Rp (y_axis_indicator - position: Indicated by vertical double-headed arrow spanning from y=0 to the intersection point y≈6.2)
- Specified non-proportional extension (x_axis_indicator - position: Indicated by horizontal double-headed arrow on the x-axis from x=0 to x=1.0)
- 0 (text_label - position: x=0, y=0)
- Force (axis_label - position: y-axis)
- Extension (axis_label - position: x-axis)
| Extension (arbitrary units) | Force (arbitrary units) | Category |
|---|---|---|
| 0.0 | 0.0 | Main Loading Curve |
| 0.5 | 2.0 | Main Loading Curve |
| 1.0 | 3.8 | Main Loading Curve |
| 1.5 | 5.0 | Main Loading Curve |
| 2.0 | 5.8 | Main Loading Curve |
| 2.5 | 6.2 | Main Loading Curve |
| 3.5 | 6.8 | Main Loading Curve |
| 0.0 | 0.0 | Initial Linear Projection (dashed) |
| 1.5 | 6.0 | Initial Linear Projection (dashed) |
| 1.0 | 0.0 | Offset Parallel Line (dashed) |
| 2.5 | 6.0 | Offset Parallel Line (dashed) |
| 2.5 | 6.2 | Loop - Unloading |
| 2.3 | 4.0 | Loop - Unloading |
| 2.1 | 2.0 | Loop - Unloading |
| 2.0 | 1.0 | Loop - Unloading |
| 2.0 | 1.0 | Loop - Reloading |
| 2.2 | 3.5 | Loop - Reloading |
| 2.5 | 6.2 | Loop - Reloading |
| 2.0 | 1.0 | Loop - Median (dashed) |
| 2.5 | 6.2 | Loop - Median (dashed) |
Notes: The graph depicts a typical tensile test curve where a specified non-proportional extension is used to find the corresponding force (Rp. A loading-unloading loop is also shown, illustrating hysteresis and the method for determining the mean slope or median line within the loop.)
Figure 6 — Proof strength, non-proportional extension ( ) (see 13.1)
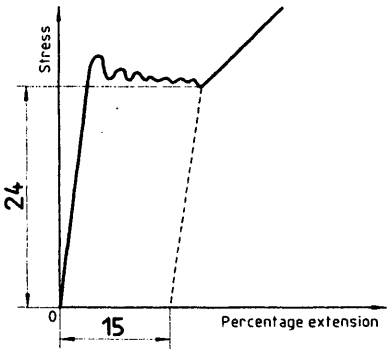
Figure description:
Material Stress-Strain Behavior
Stress vs. Percentage Extension
Annotations
- 24 (text_label - position: y = 24)
- 15 (text_label - position: x = 15)
- Yield Plateau (text_label - position: Region between extension ~3.5 and ~18.5)
- Elastic Recovery Path (shaded_area - position: Dashed line from (18.5, 24 to (15, 0)))
| Percentage extension | Stress (Main Curve) | Unloading Path |
|---|---|---|
| 0.0 | 0 | null |
| 3.5 | 24 | null |
| 4.5 | 26 | null |
| 6.0 | 23 | null |
| 7.5 | 25 | null |
| 9.0 | 24 | null |
| 11.0 | 25 | null |
| 13.0 | 24 | null |
| 15.0 | 24.5 | 0 |
| 18.5 | 24 | 24 |
| 25.0 | 35 | null |
Notes: The graph shows a typical stress-strain curve for a material exhibiting a yield plateau and strain hardening. The value '24' represents the stress at the start of the yield plateau. The value '15' represents the permanent percentage extension (plastic strain remaining after unloading from the end of the yield plateau, indicated by the dashed line which is parallel to the initial linear elastic portion of the curve.)
NOTE — See table 1 for explanation of reference numbers.
Figure 7 — Percentage yield point extension (Ae)
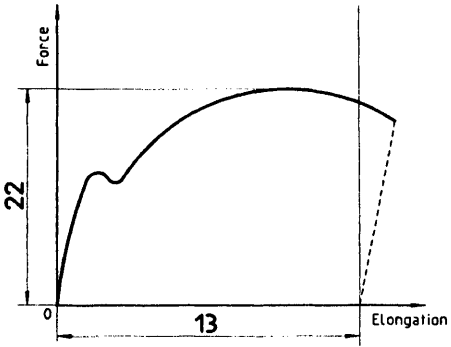
Figure description:
Force-Elongation Diagram
Force-Elongation Curve
Annotations
- 22 (text_label - position: y = 22 (Maximum Force))
- 13 (text_label - position: x = 13 (Elongation at fracture))
| Elongation | Force | Type |
|---|---|---|
| 0.0 | 0.0 | Solid Curve |
| 0.5 | 6.0 | Solid Curve |
| 1.0 | 12.0 | Solid Curve |
| 1.8 | 16.0 | Solid Curve |
| 2.3 | 15.0 | Solid Curve |
| 3.0 | 16.5 | Solid Curve |
| 4.0 | 18.2 | Solid Curve |
| 5.0 | 19.5 | Solid Curve |
| 7.0 | 21.3 | Solid Curve |
| 9.0 | 22.0 | Solid Curve |
| 11.0 | 21.3 | Solid Curve |
| 13.0 | 20.0 | Solid Curve |
| 13.0 | 20.0 | Dashed Line |
| 12.2 | 0.0 | Dashed Line |
Notes: The chart illustrates a typical force-elongation curve for a material exhibiting a distinct yield point, strain hardening, and a peak force value before failure. The solid line depicts the loading phase until fracture, and the dashed line represents the elastic recovery (unloading path from the point of fracture at an elongation of 13.)
NOTE — See table 1 for explanation of reference numbers.
Figure 8 — Maximum force
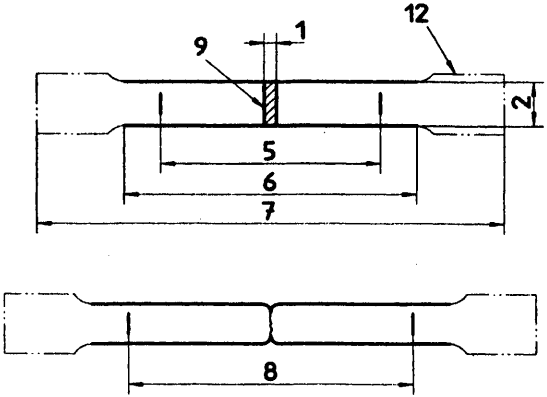
Figure description:
This is a technical diagram of a tensile test specimen showing its dimensions before and after fracture.
Key Dimensions and Features:
- 1: Width of the central area or gauge length increment.
- 2: Width/thickness of the specimen's narrow section.
- 5: Initial gauge length between two marks.
- 6: Length of the reduced section.
- 7: Total length of the specimen.
- 8: Final gauge length after specimen fracture (shown in the lower image.
- 9: Cross-hatched central section.
- 12: Specimen shoulder/grip area.
Notes
- 1 The shape of the test piece heads is given only as a guide.
- 2 See table 1 for explanation of reference numbers.
Figure 9 — Machined test pieces of rectangular cross section (see annex A)
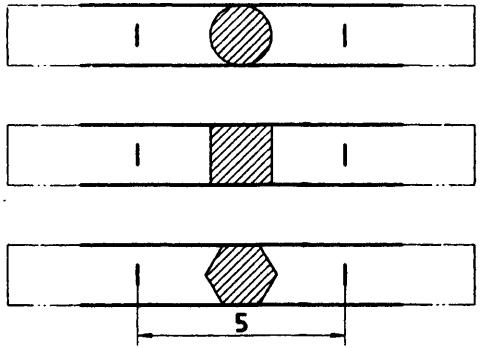
Figure description:
Technical diagram illustrating three different material cross-sections within a bar:
- Top: Circular cross-section.
- Middle: Square cross-section.
- Bottom: Hexagonal cross-section.
- Key Details:
- Shaded (hatched areas represent the cross-sectional profiles.
- Vertical reference marks are positioned on either side of the center shapes.
- A dimension of 5 is indicated between the reference marks in the bottom illustration.
Notes
- 1 The shape of the test piece heads is given only as a guide.
- 2 See table 1 for explanation of reference numbers.
Figure 10 — Test pieces comprising a non-machined portion of the product (see annex B)
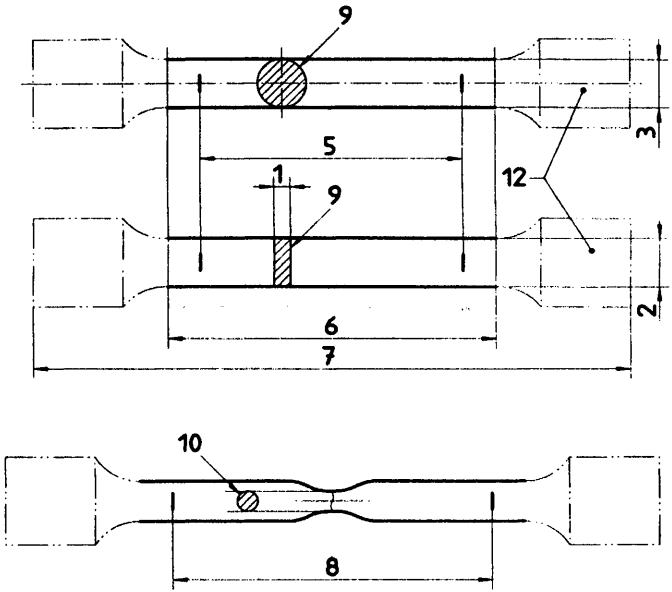
Figure description:
Technical diagram of tensile test specimens, showing both rectangular and cylindrical geometries before and after failure.
Key Entities and Dimensions:
- 1 & 2: Thickness and width of a rectangular specimen cross-section.
- 3: Diameter of a cylindrical specimen cross-section.
- 5: Initial gauge length (.
- 6: Length of the reduced (parallel section.
- 7: Total length of the specimen.
- 8: Final gauge length after fracture (, showing elongation.
- 9: Initial cross-sectional areas (circular and rectangular.
- 10: Reduced cross-sectional area at the point of fracture (necking.
- 12: Grip sections for securing the specimen in a testing machine.
Notes
- 1 The shape of the test piece heads is given only as a guide.
- 2 See table 1 for explanation of reference numbers.
Figure 11 — Proportional test pieces (see annex C)
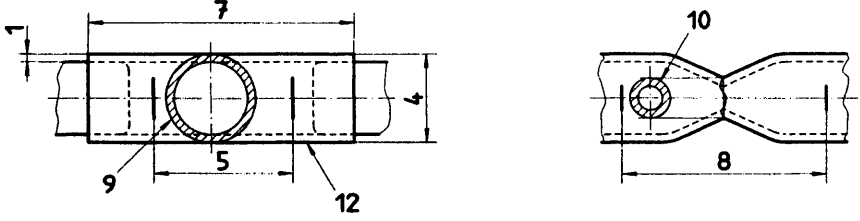
Figure description:
Figure 11 - Proportional test pieces
Key Dimensions and Entities:
- 1: Wall thickness of the tube.
- 4: External diameter of the tube.
- 5: Original gauge length (.
- 7: Parallel length (.
- 8: Final gauge length after fracture (.
- 9: Cross-section of the tube (represented by a circular hatched area.
- 10: Gripped end of the test piece (flattened for testing.
- 12: Parallel part of the test piece.
NOTE — See table 1 for explanation of reference numbers.
Figure 12 — Test pieces comprising a length of tube (see annex D)
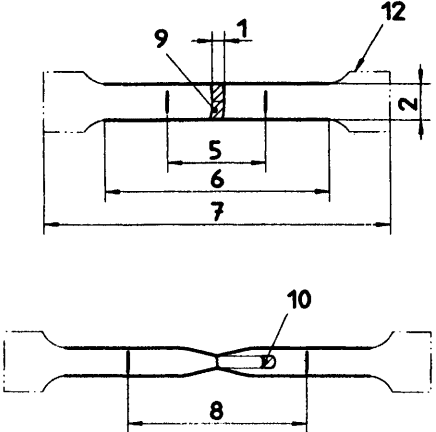
Figure description:
This technical drawing illustrates a tensile test specimen (dog-bone shape with key dimensions and features labeled:
- 1: Width of the central gauge zone.
- 2: Width of the parallel reduced section.
- 5: Original gauge length (.
- 6: Total length of the parallel reduced section (.
- 7: Total overall length of the specimen.
- 8: Final distance between gauge marks after fracture (.
- 9: Cross-sectional area indicator at the center.
- 10: Fracture location showing necking.
- 12: Transition radius (fillet between the grip section and reduced section.
Notes
- 1 The shape of the test piece heads is given only as a guide.
- 2 See table 1 for explanation of reference numbers.